THE BIG PICTURE
Investors are still operating in a climate that’s prone to volatility so it pays to remain focused on stock market trends within your given timeframe.
Stocks have recovered sharply but there is still plenty of “noise” due to market crosscurrents and bull vs bear chatter. Traders need to follow the price action (and trend indicators) and steer clear of noise and opinions. If the market correction/consolidation continues, your process (and stops and limits) should offer you new looks on both the long & short side of trades.
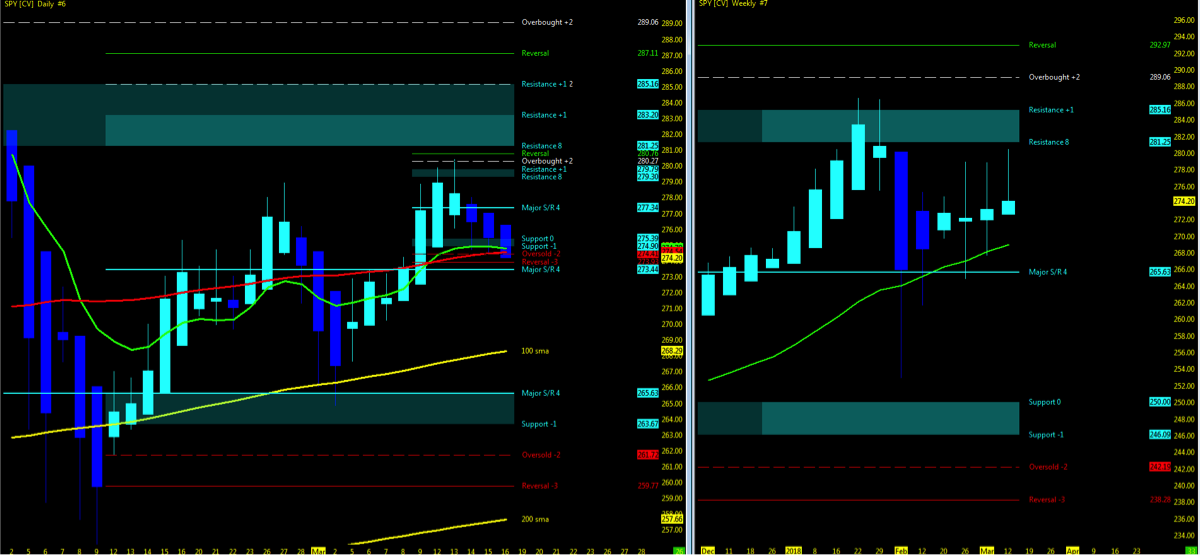
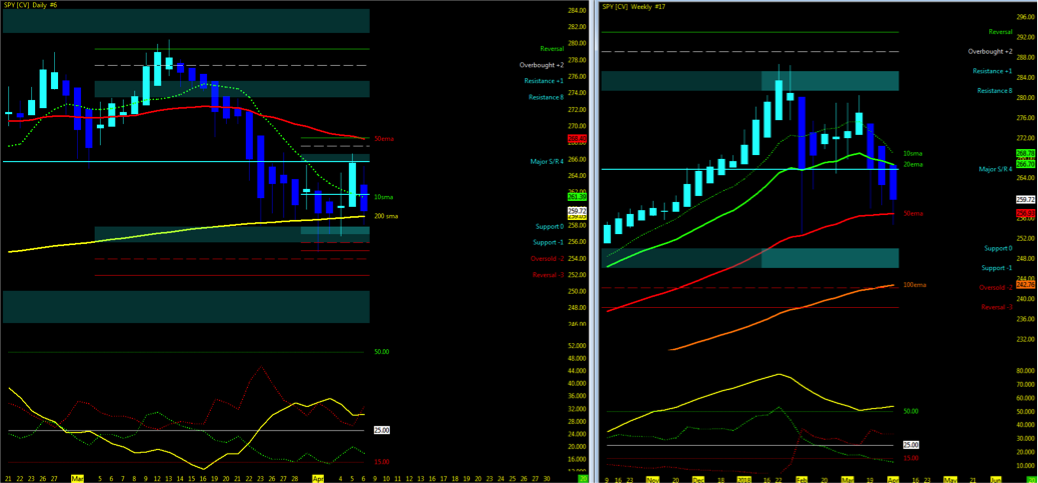
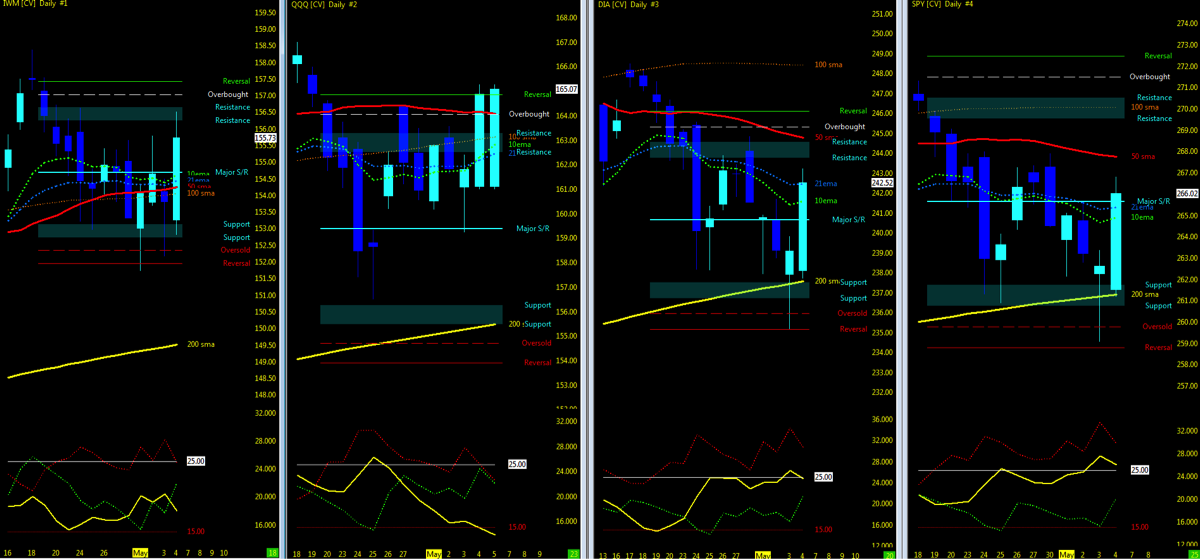
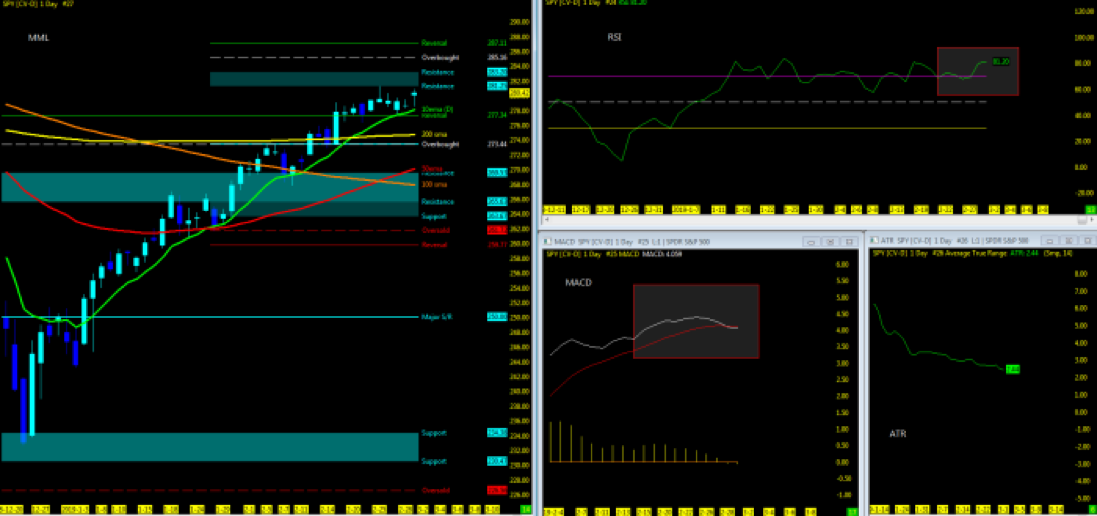
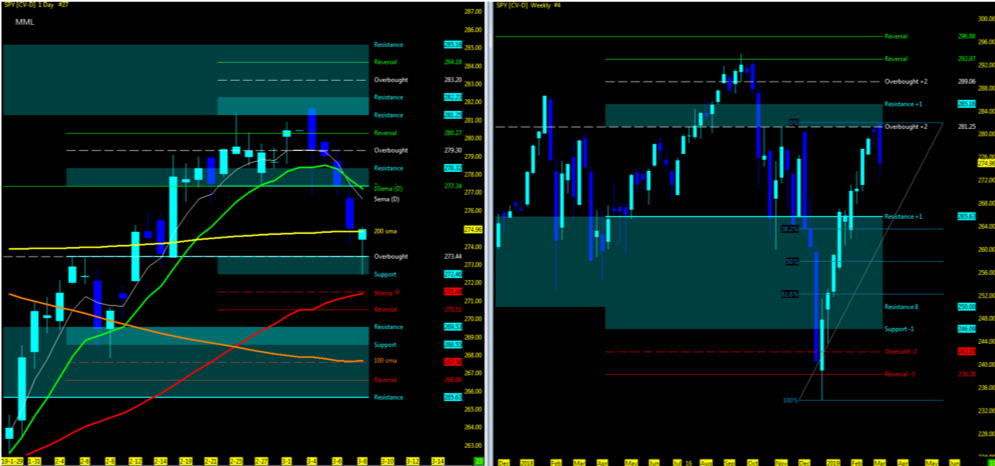
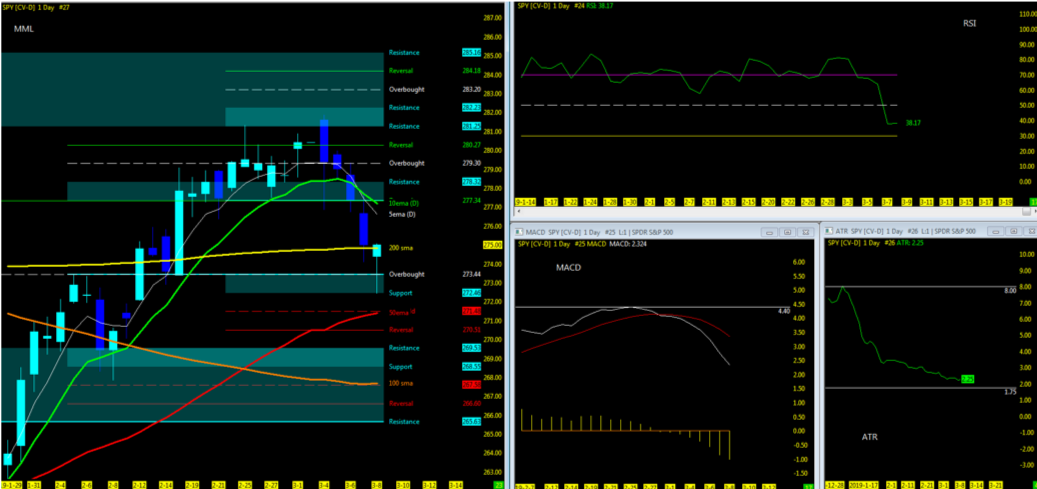
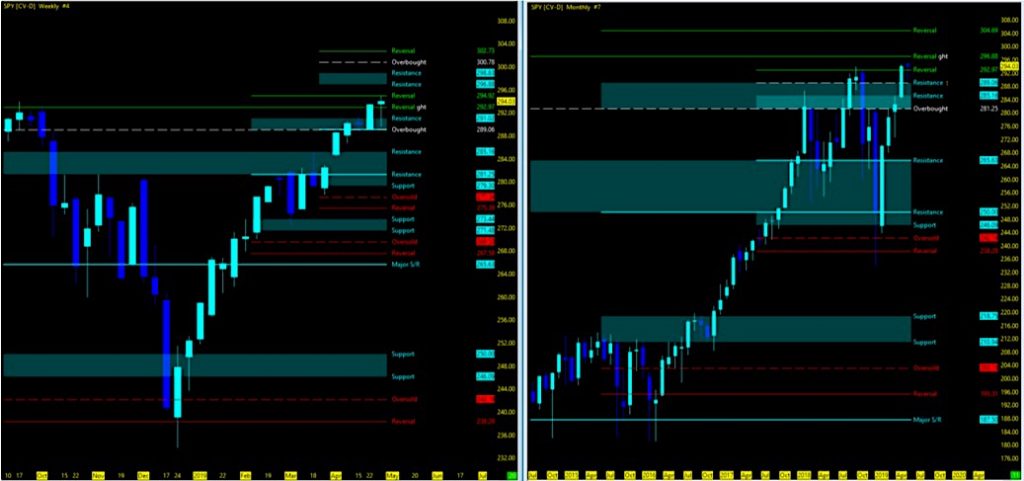
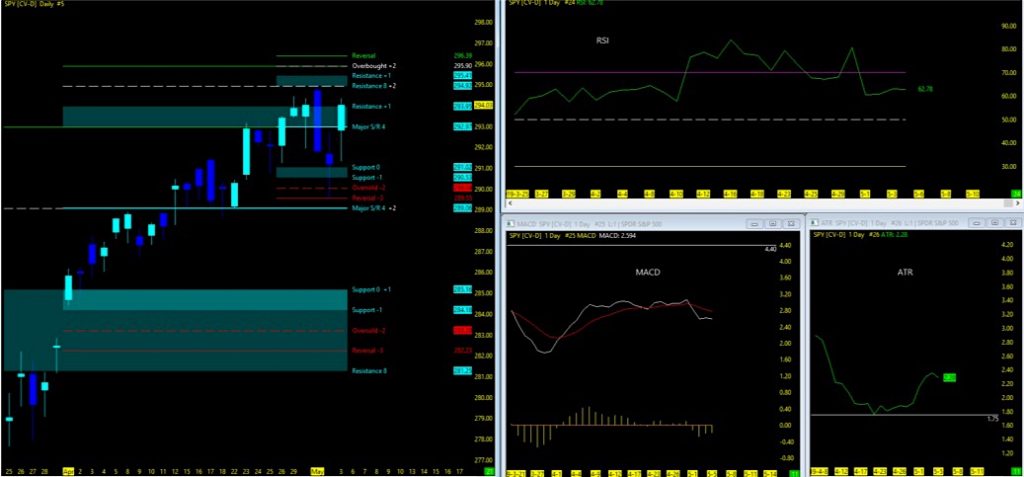
Below is my weekly trading update and stock market trends outlook. Let’s start by looking at a chart of the S&P 500 ETF (SPY).
S&P 500 Chart – Week 11 (week of March 12)
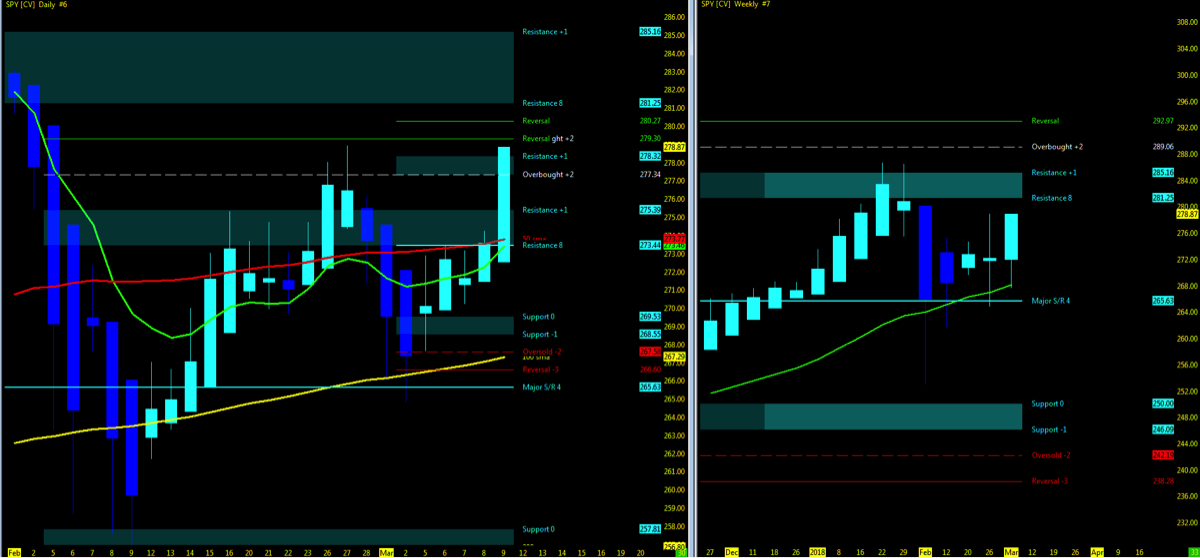
Attempting to determine which way a market will go on any given day is merely a guess in which some will get it right and some will get it wrong. Being prepared in either direction intraday for the strongest probable trend is by plotting your longer term charts and utilizing an indicator of choice on the lower time frame to identify the setup and remaining in the trade that much longer. Any chart posted here is merely a snapshot of current technical momentum and not indicative of where price may lead forward.
Current Technical Trends…
- Check out our week 10 recap and trend charts
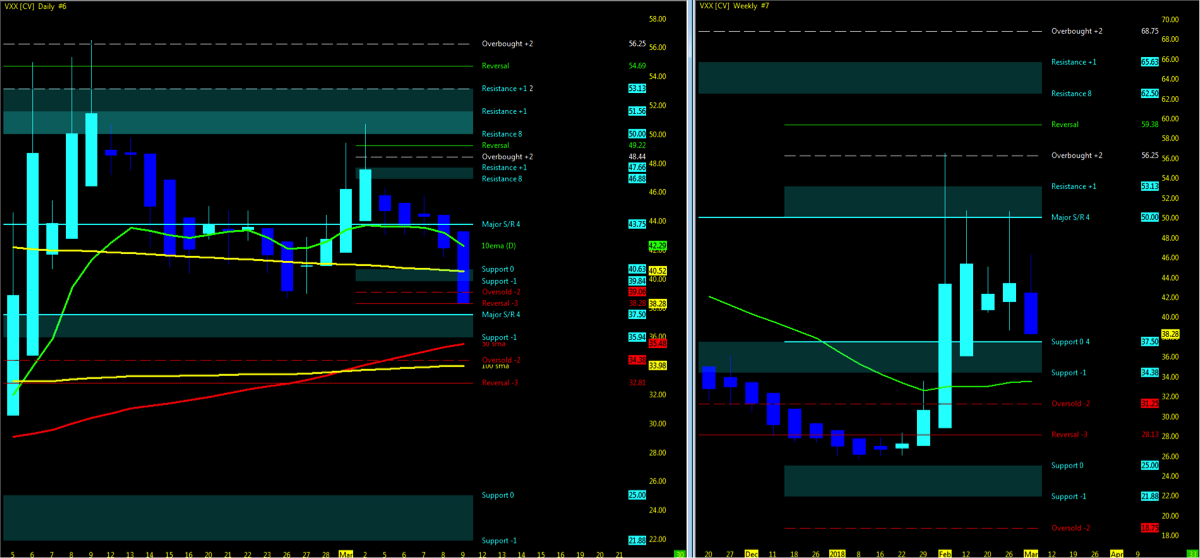
- VIX Volatility Index levels are in the high 14’s (just down from recent highs)
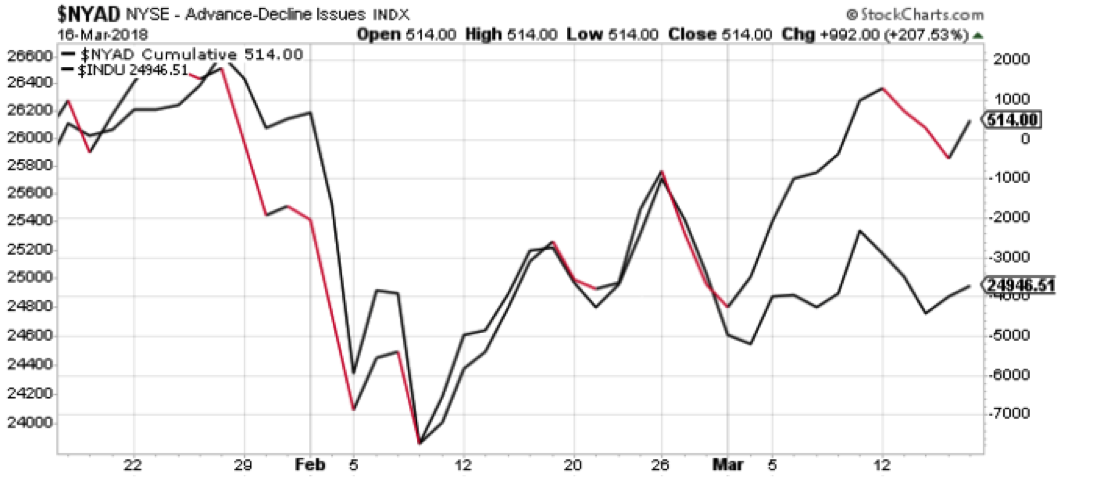
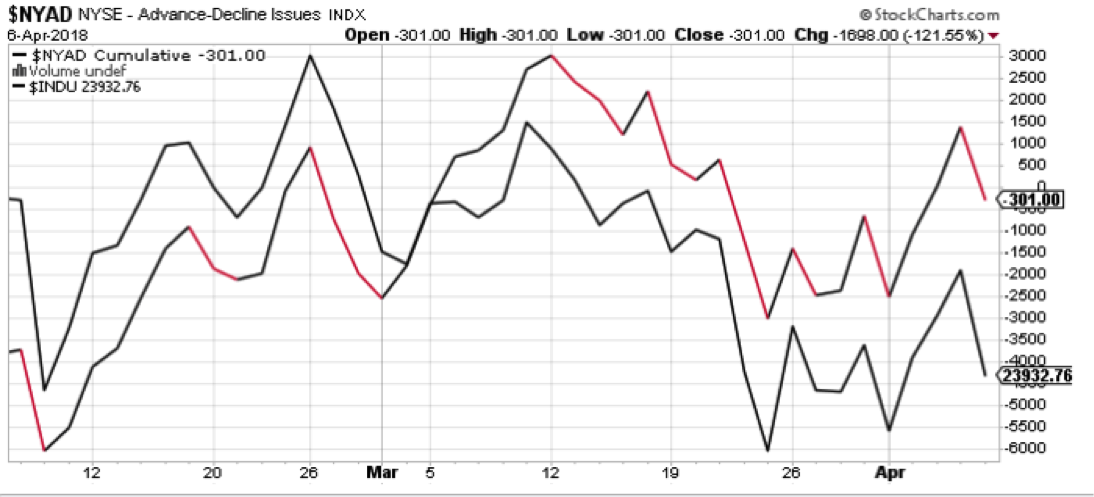
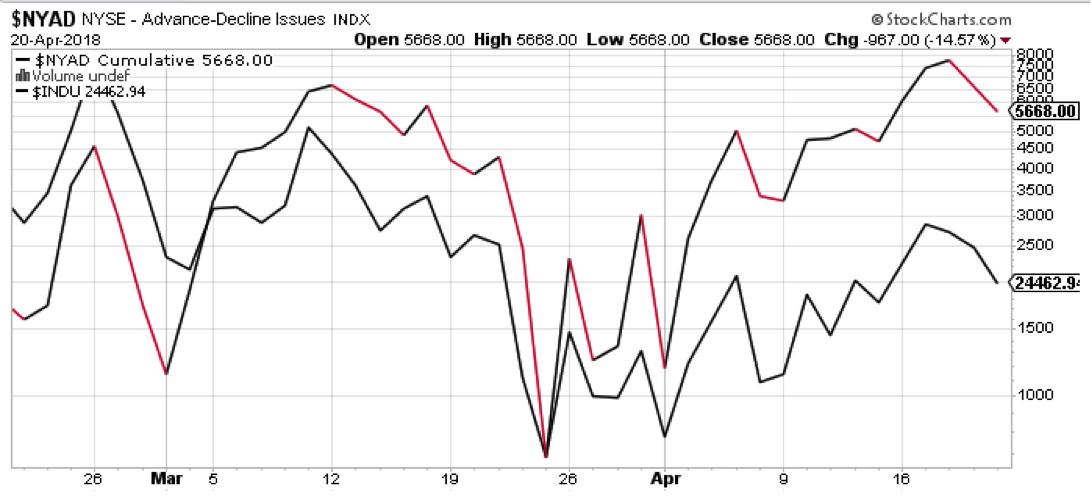
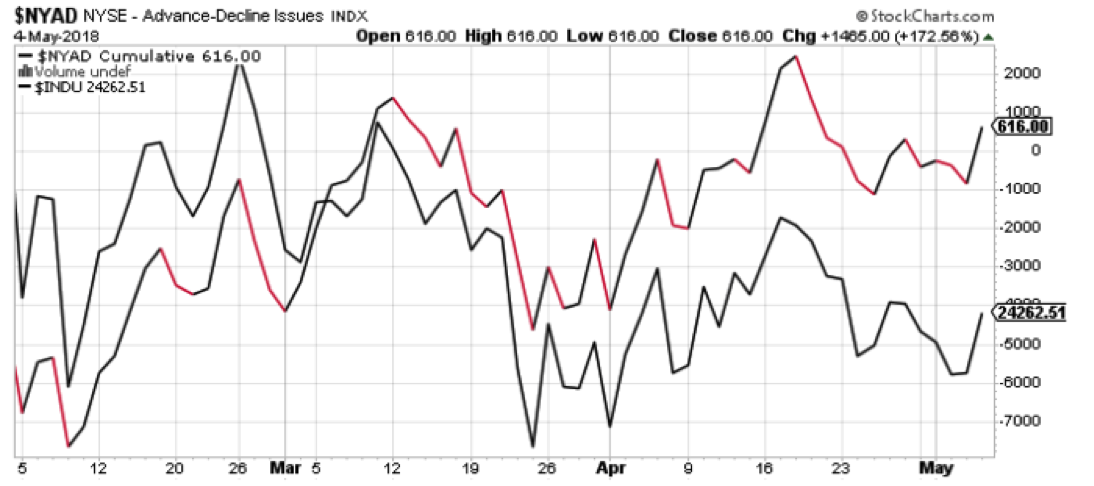
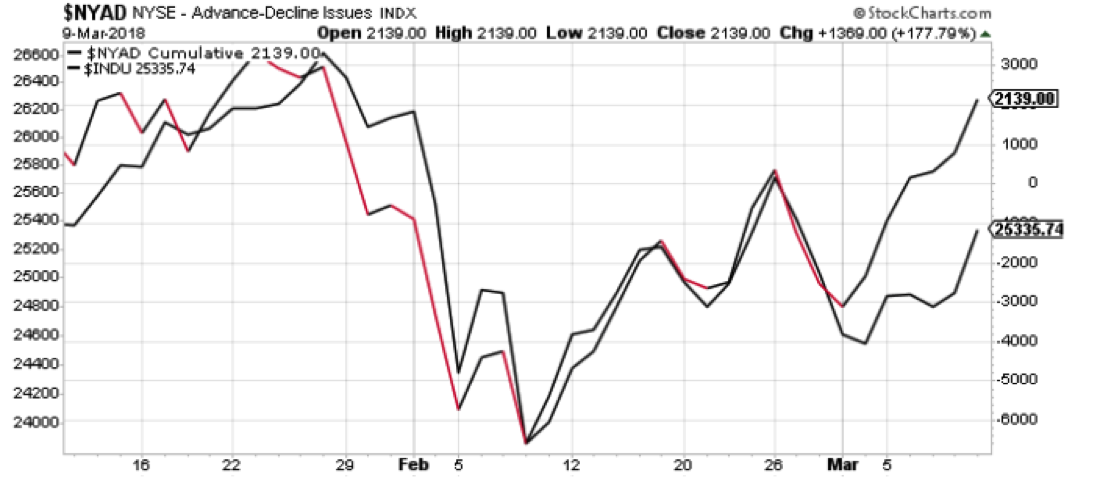
- NYSE Advance-Decline line is in sync with the Dow Jones Industrial Average – UPTREND
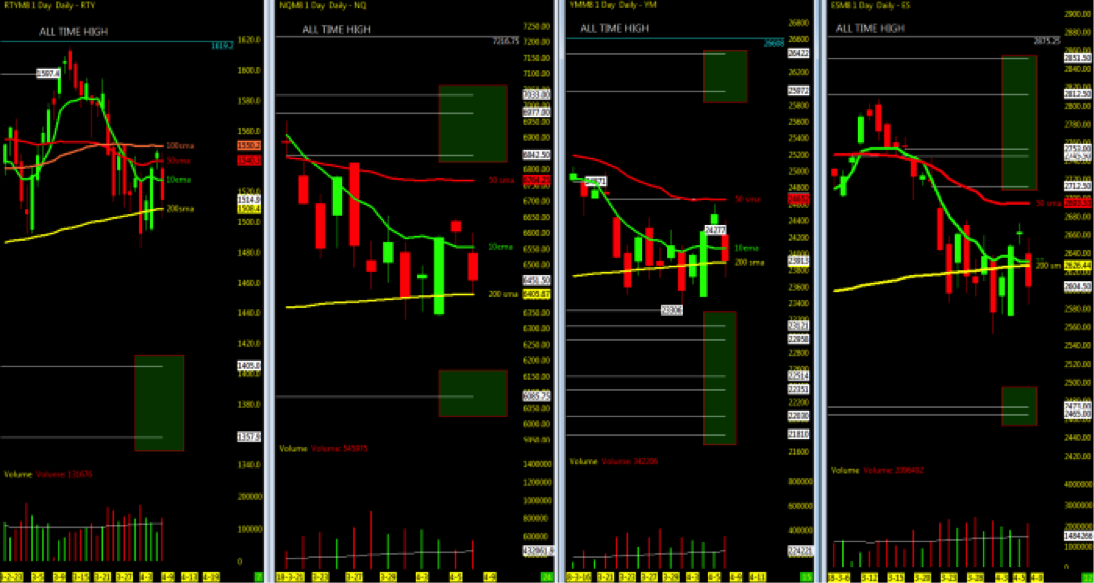
- Indices back at (NQ) or near (ES/YM/RTY) all time highs
- Lowest Open Gaps
- ES: 1589 | NQ: 3864.75 | RTY: 1462.1 | YM: 14745
The Bottom Line
What an amazing rush to finish off week 10 as the NQ breaks and makes new all time highs. That surely put the permabears out to pasture.
As we head into Quad Witch week and earnings season slowing down only to begin here shortly once again, the overall sense remain positive and upbeat as market regains traction and continues to drive higher. So the big question is, do we remain in this chop off the lows of the 200ma to the highs in consolidation, or do we charge ahead with higher highs on the US indices?
As any optimistic trader, I too have upper levels that the market may achieve and likewise, just as many to the downside. My own personal “probability formula” has no mathematical basis as for intraday setups, we simply watch the momentum of the chart as it plays out with absolutely NO BIAS. As for the long term, I prefer to analyze four times a year and simply re-balance the portfolio. For the short-term, this is where the challenge lies, and by this is what I attempt to leave you with each week.
Each week the perspective I strive for is purely based on a technical outlook. To put that big picture together, I use a variety of charts and then step back and equate through a qualitative analysis of both MML support/resistance, moving averages and where price action relates to them. If I lost you there let me paint a picture.
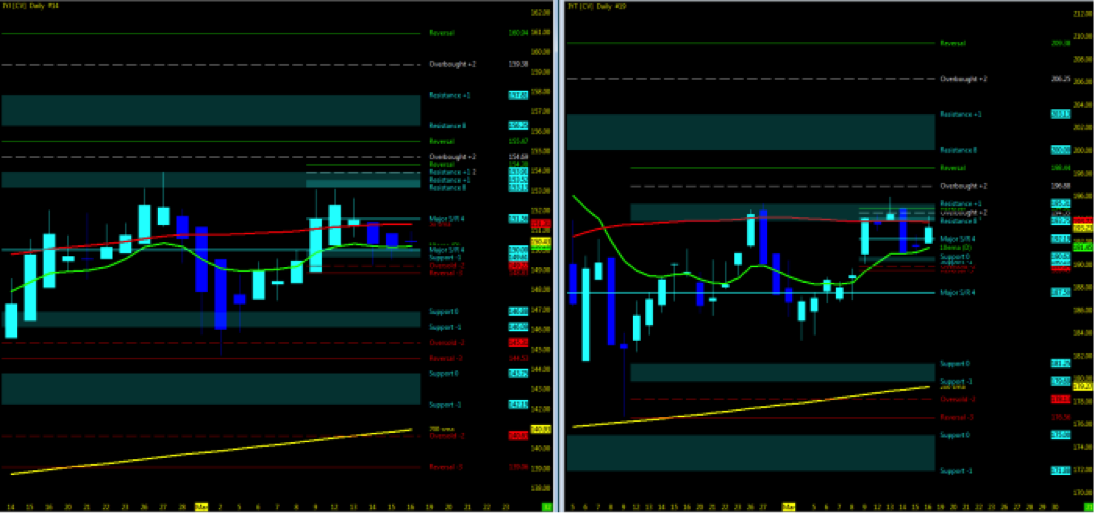
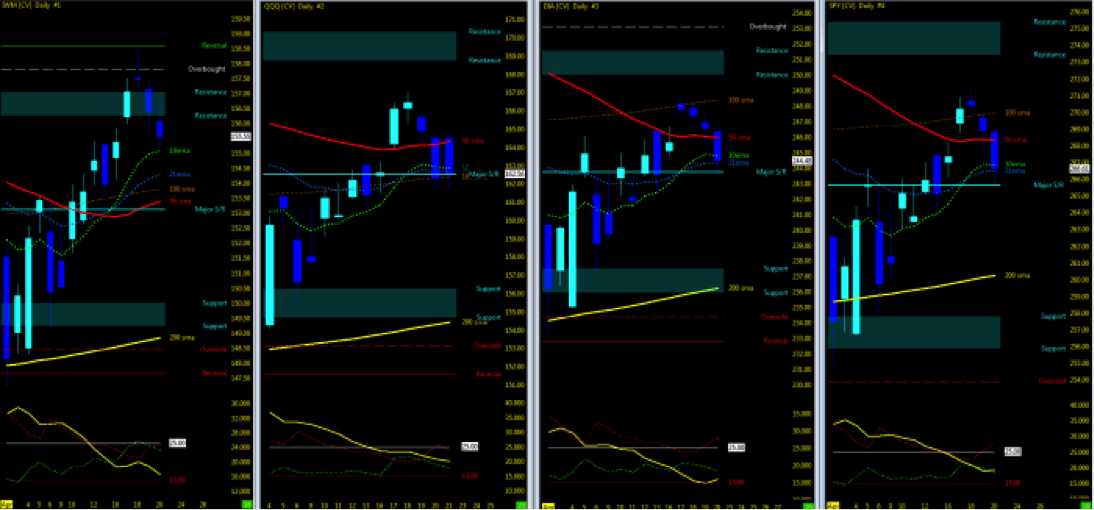
- To determine overall market momentum, I use the following ETF charts: VTI, FFTY, LDRS, SPY, VXX and UUP.
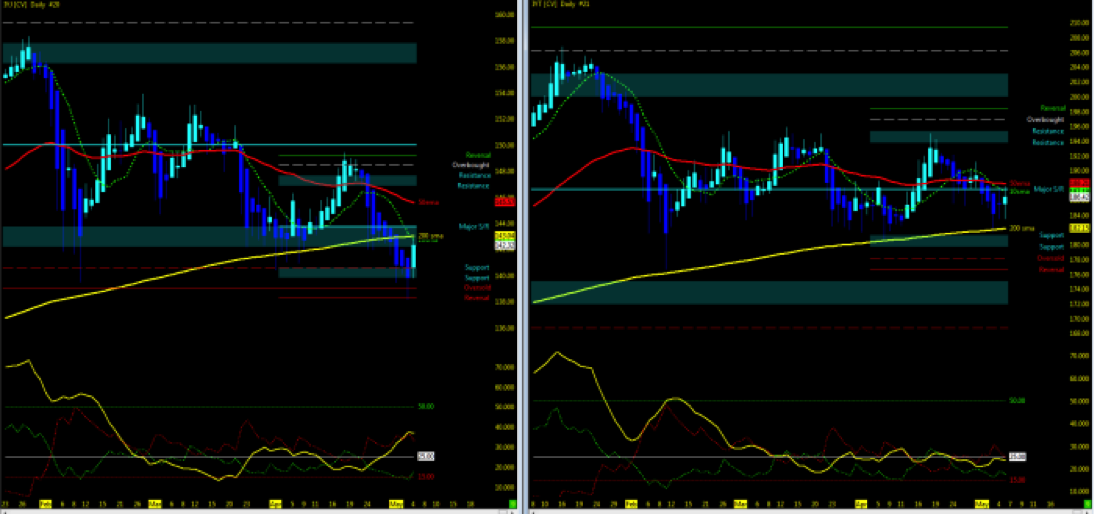
- For market pairs in sync: IYJ/IYT; NYAD/INDU; IBD Psychological market indicators
- Tech industry strength: XLK and FDN
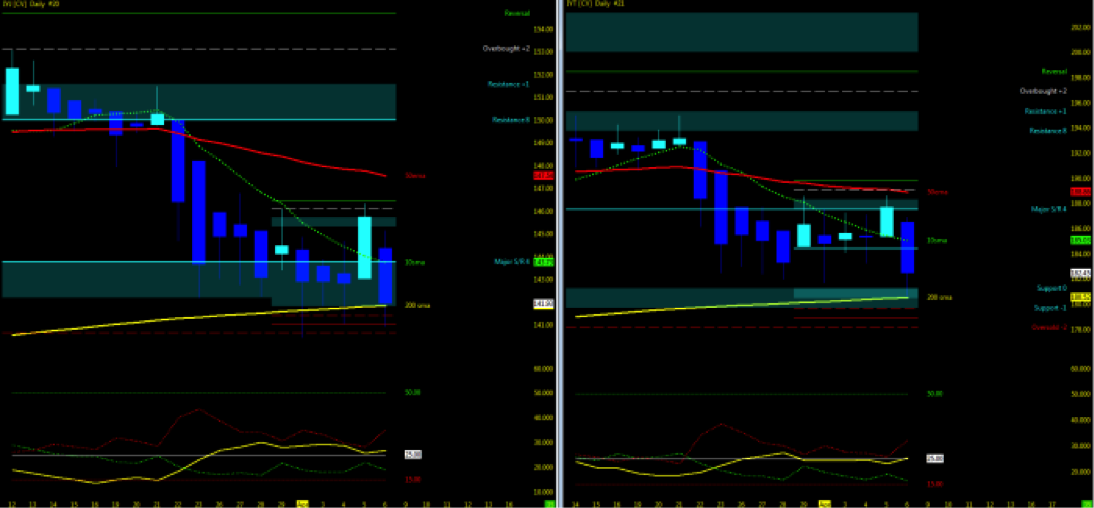
- Moving averages and candles: 10/50/200 and Hekin Ashi Flex Renko candles
Now I am sure many of you have preferences and additional indicators you may use to support your weekly hypothesis and who knows, I may even add one to the collection in time. However it isn’t rocket science and you need no graduate degree to appreciate what a market in trend looks like and have a strategy to answer two simple questions. What is my entry and what is my exit? For this Jedi trader, the Heikin Ashi bars have answered those questions and with the support of the Big Picture charts, the timing of entries have a higher chance of probability of success on continuing in trend. Timing can be everything and at this juncture, the entry was several weeks ago so the only position I support is moving one’s stop up (indices) and not initiating any new positions for the short term to either side.
Stepping back and looking ahead to week 11, the CPI data may throw a wrench into the market, but overall momentum is in only one direction right now supported from the fact that more charts as listed above lean UP then DOWN.
Watch for MML setups on price action break above resistance high and back under resistance low for first signs of a pullback. Downside, watch for open gaps to be closed and 50% pullback as 1st level of support.
Thanks for reading and remember to always use a stop at/around key technical trend levels.
Twitter: @TradingFibz
The author trades futures intraday and may have a position in the mentioned securities at the time of publication. Any opinions expressed herein are solely those of the author, and do not in any way represent the views or opinions of any other person or entity.
The post Stock Market Trends Update & Outlook (Week 11) appeared first on See It Market.