THE BIG PICTURE – What Lies Ahead?
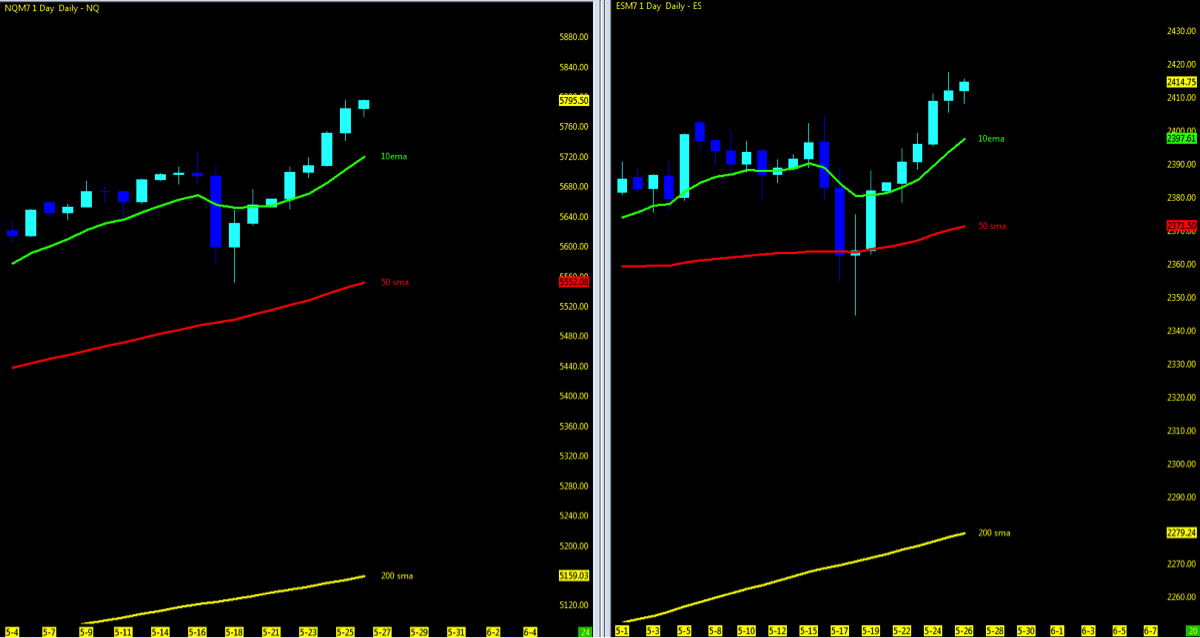
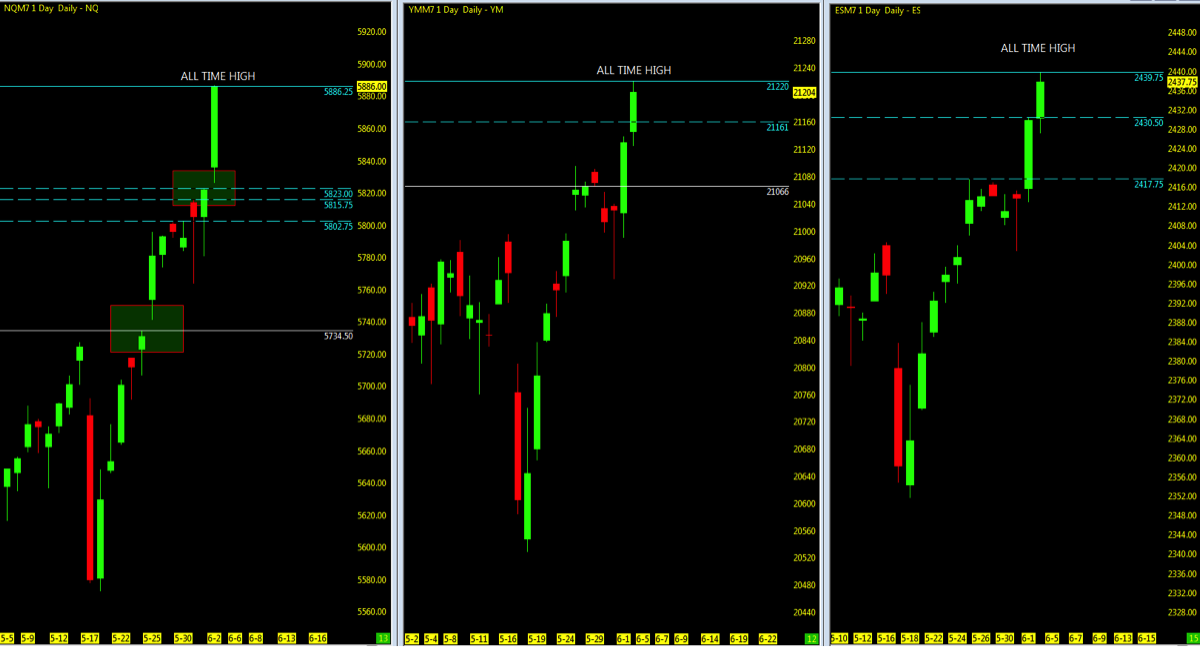
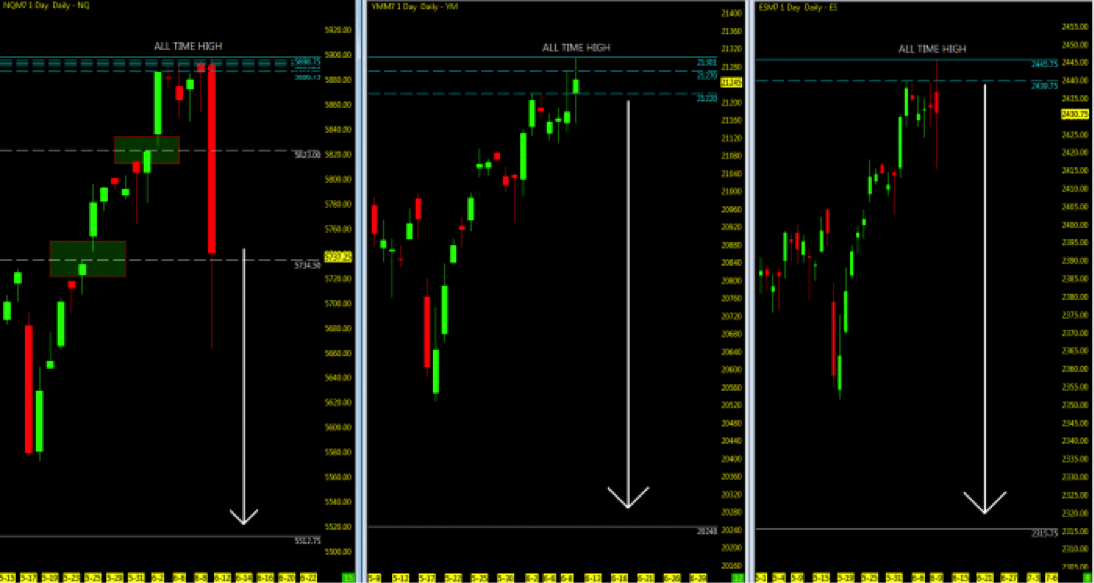
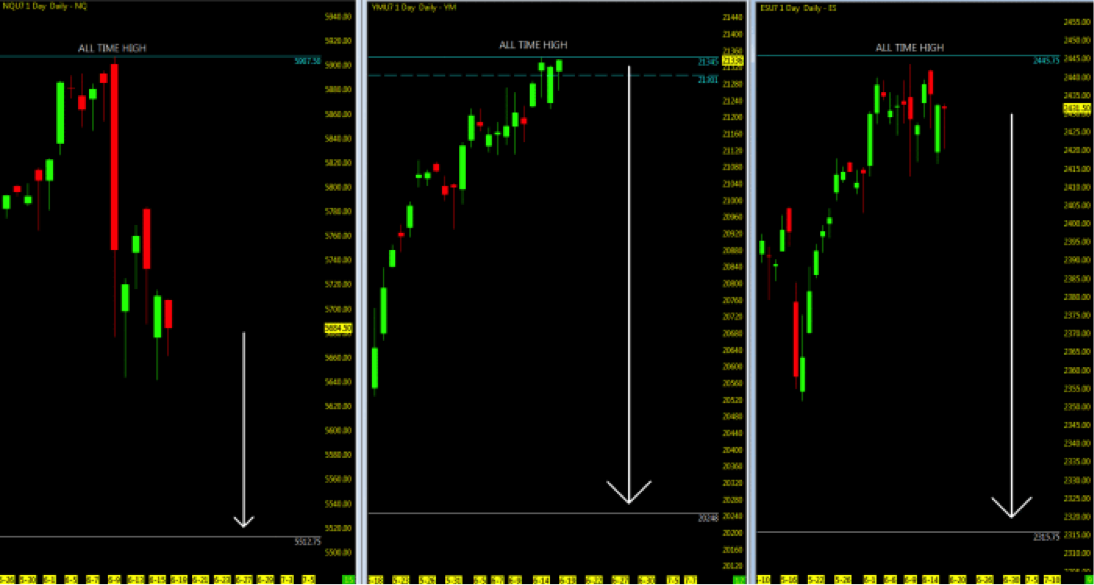
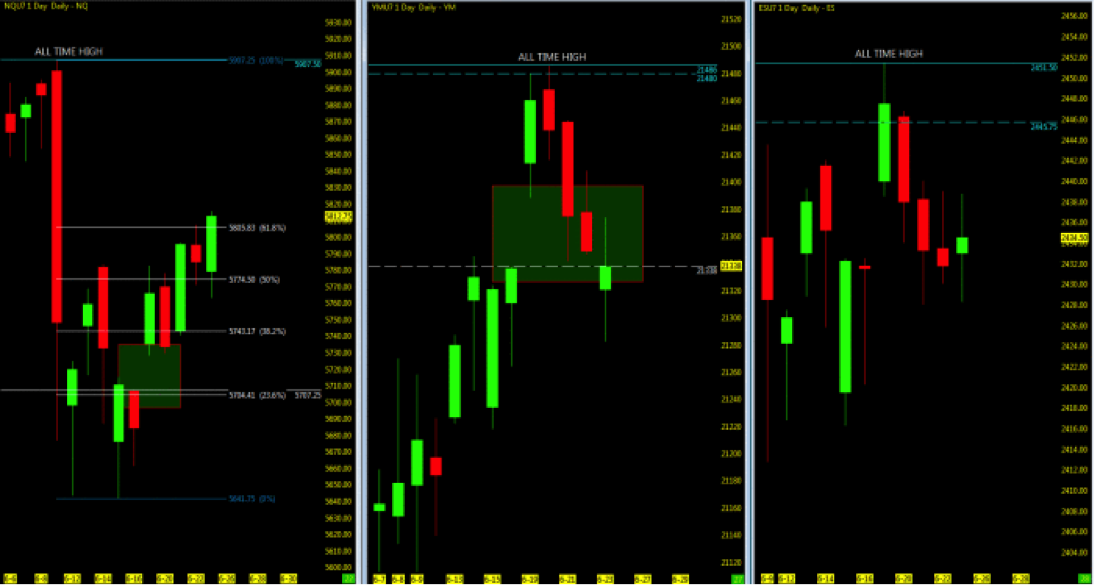
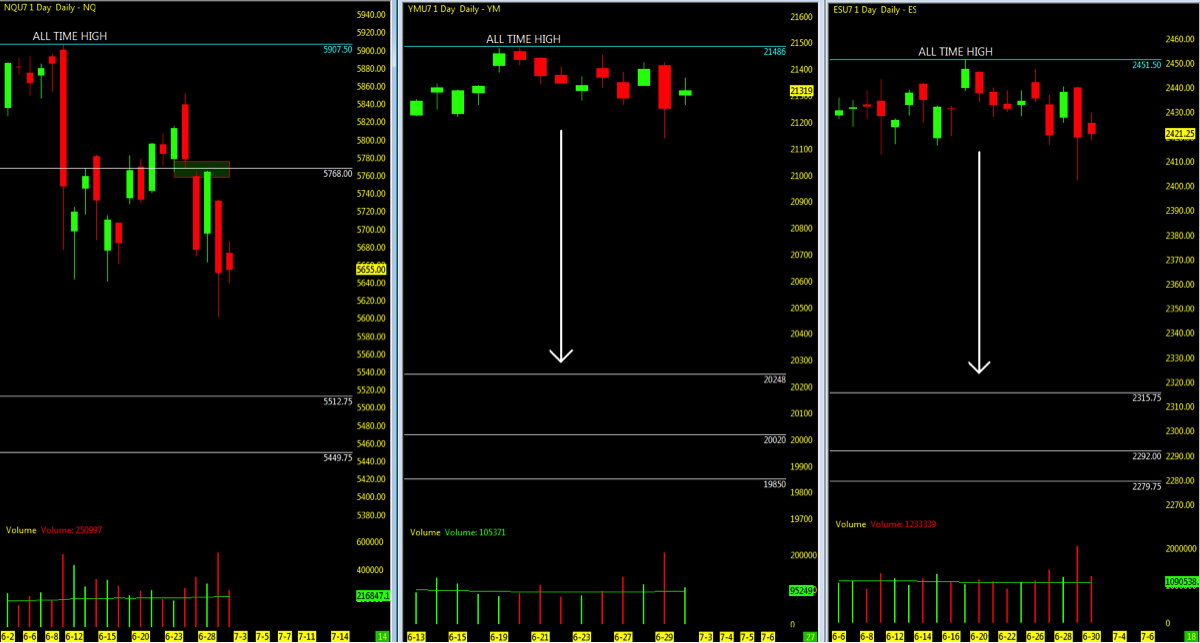
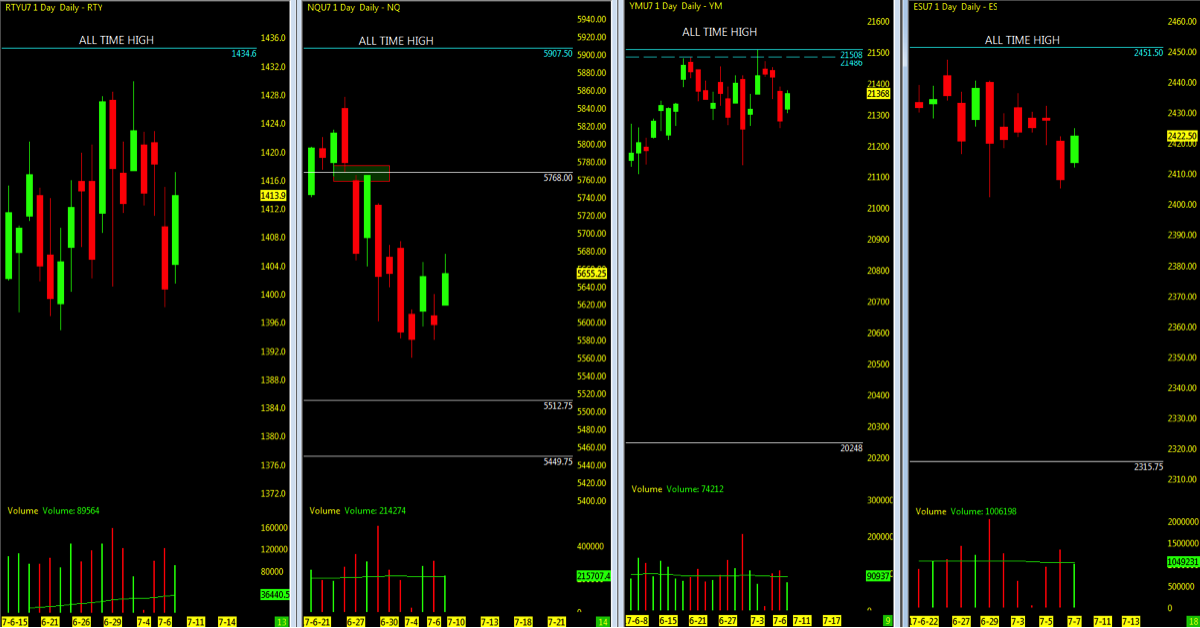
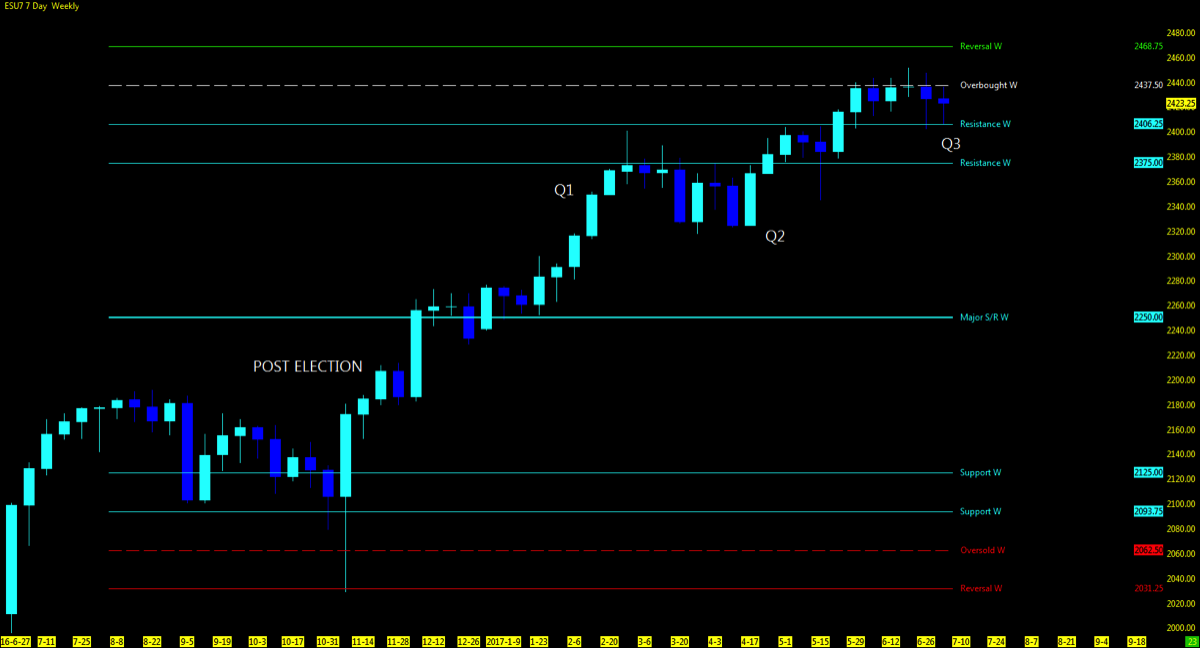
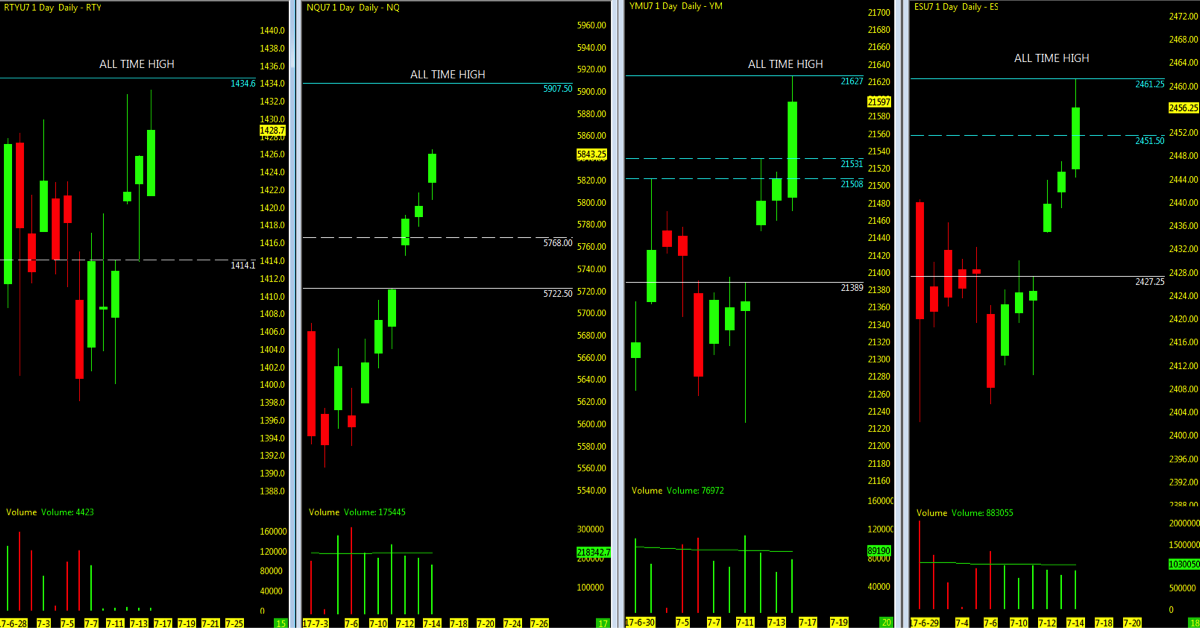
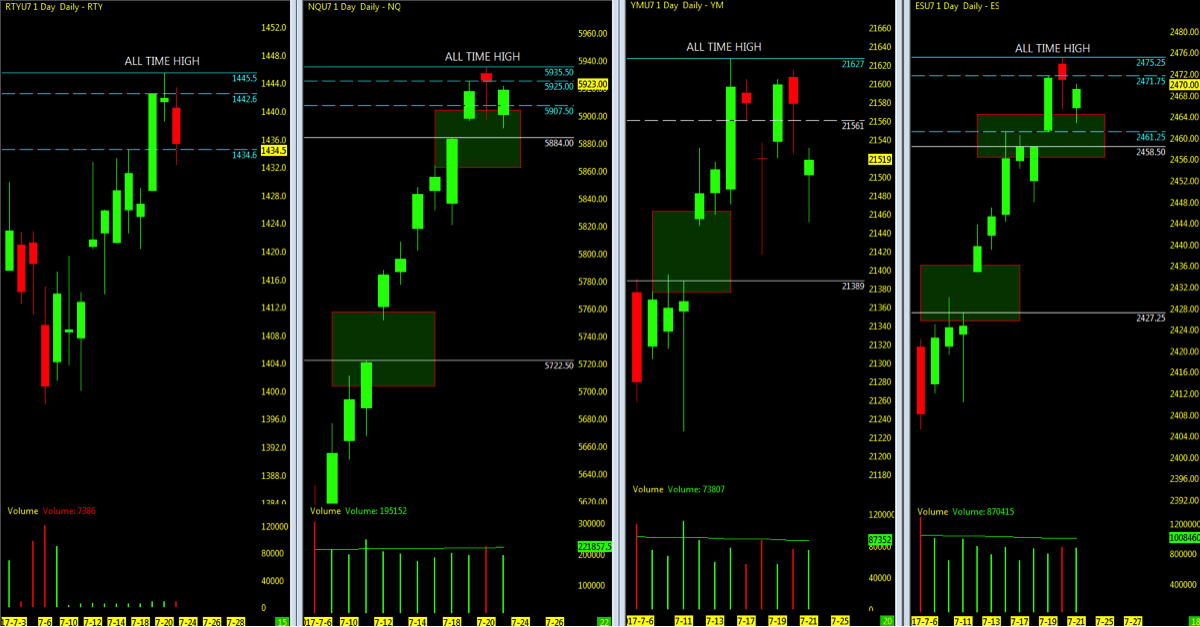
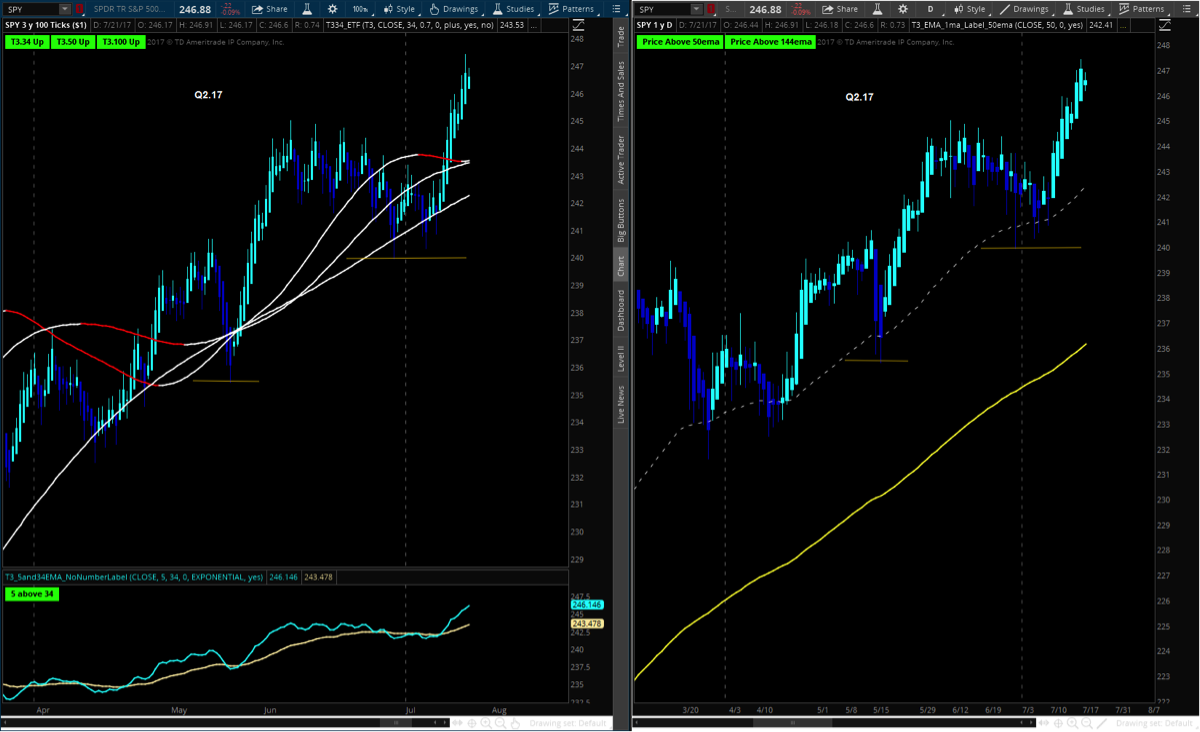
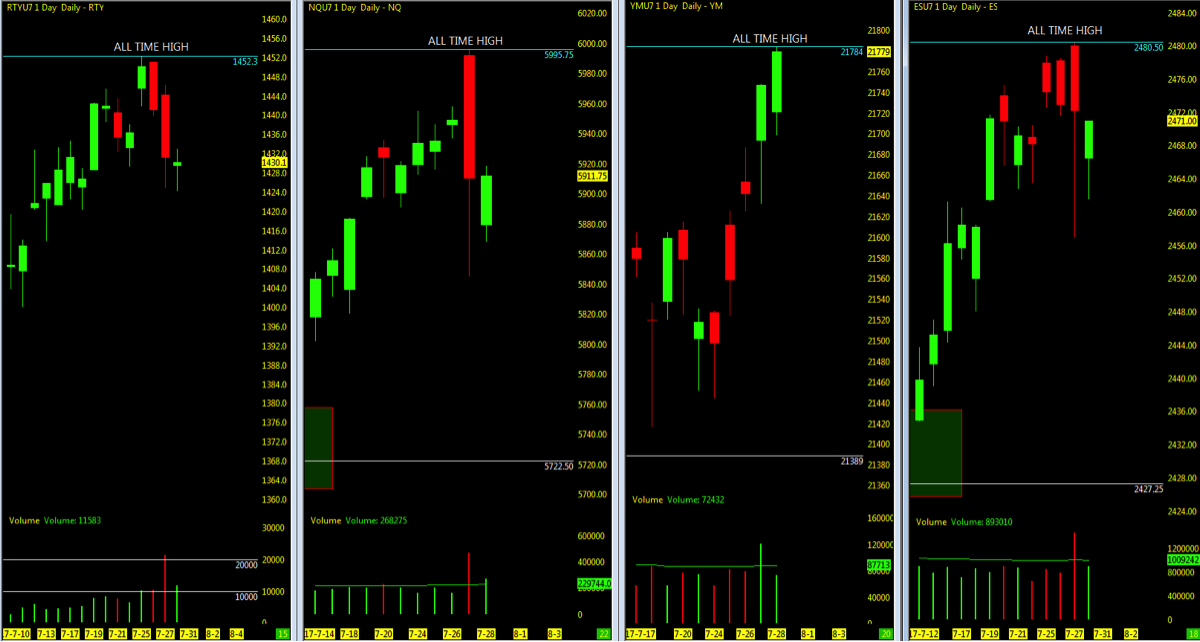
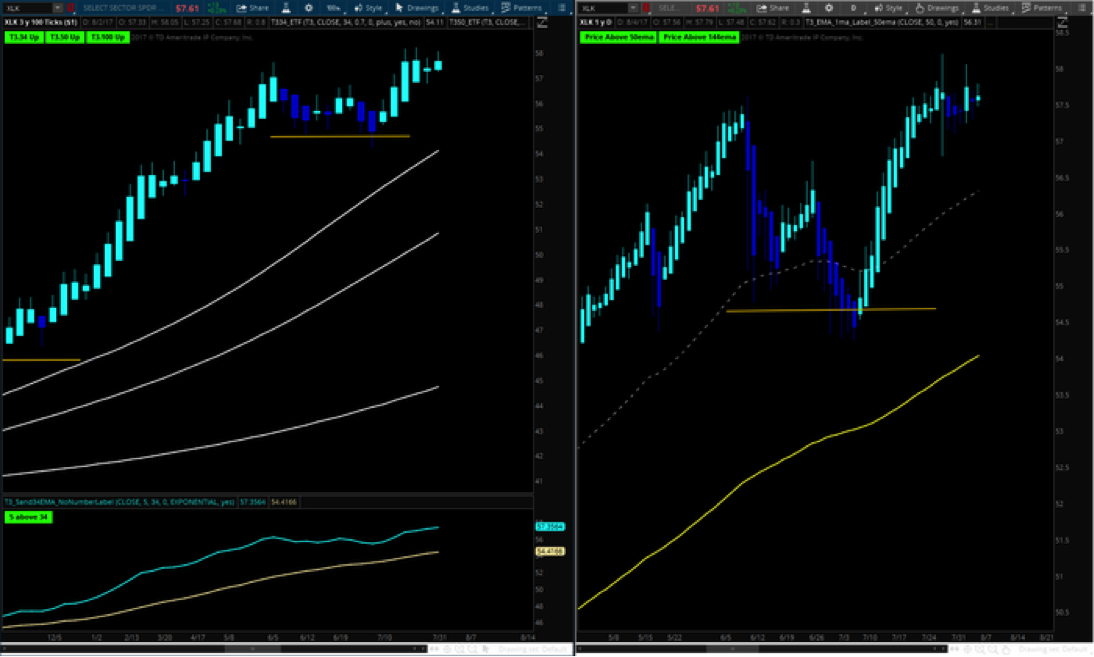
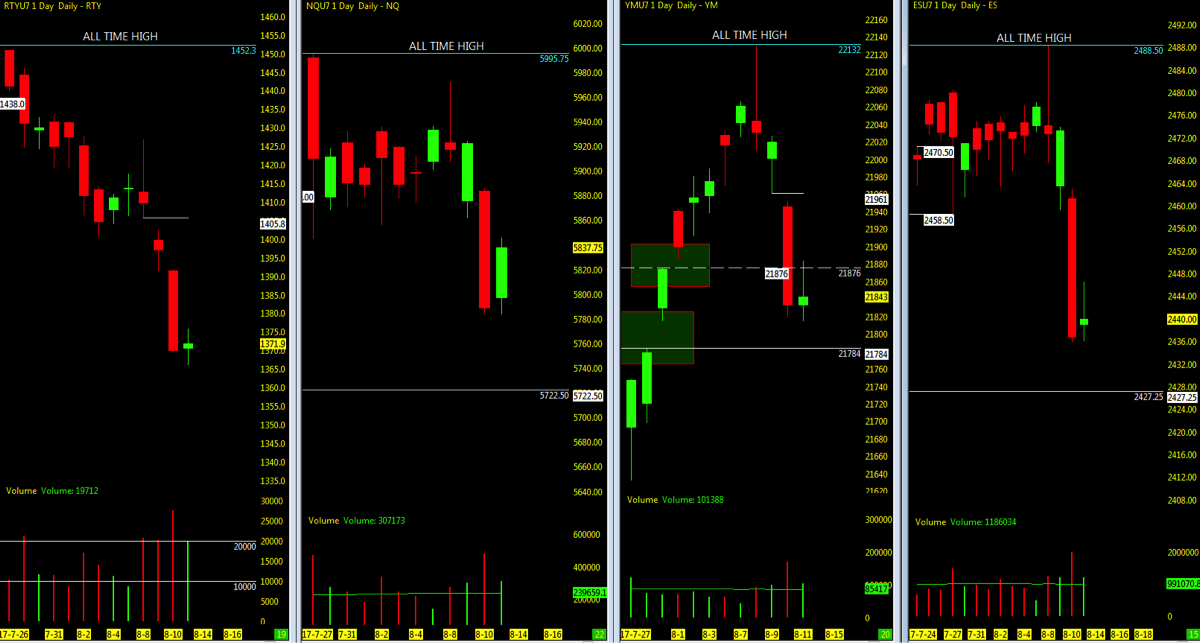
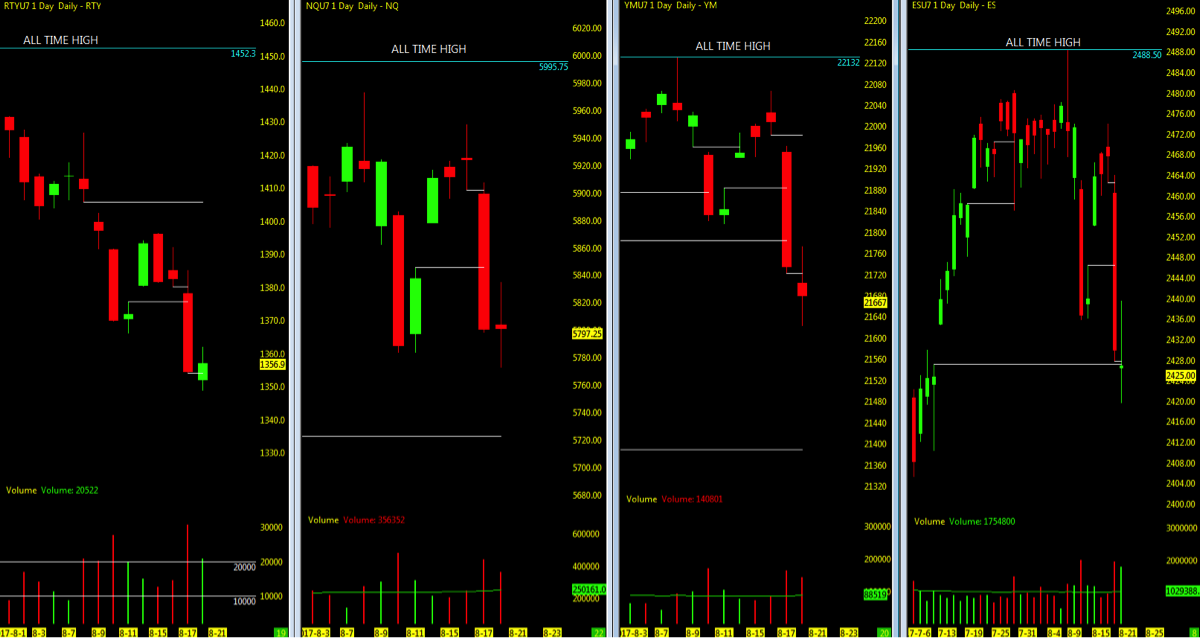
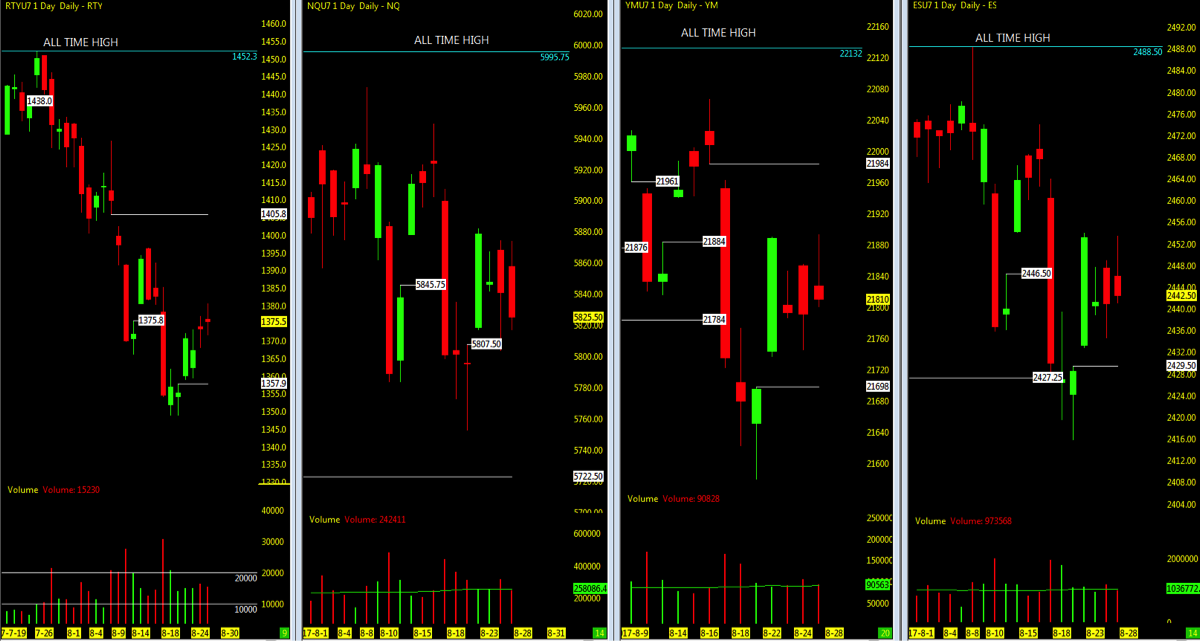
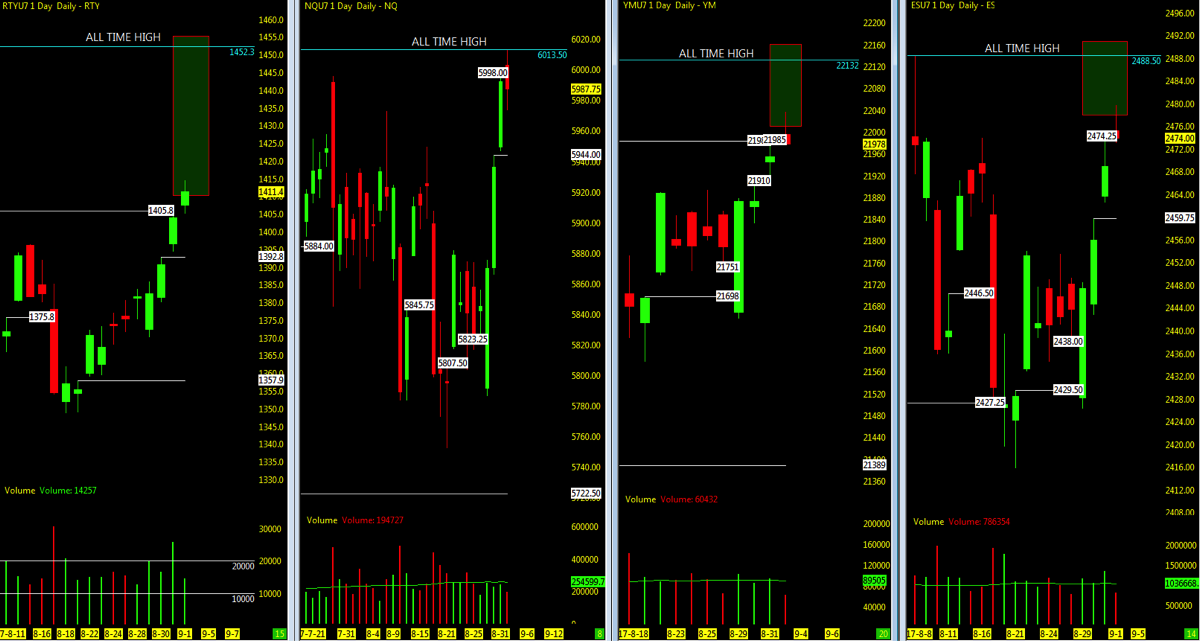
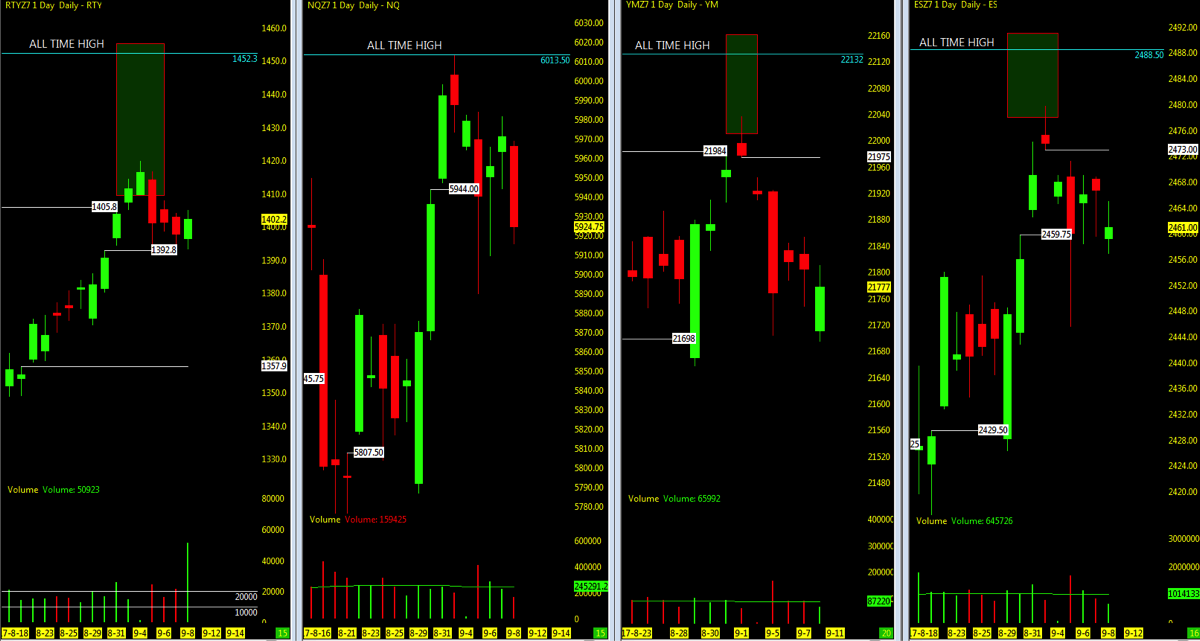
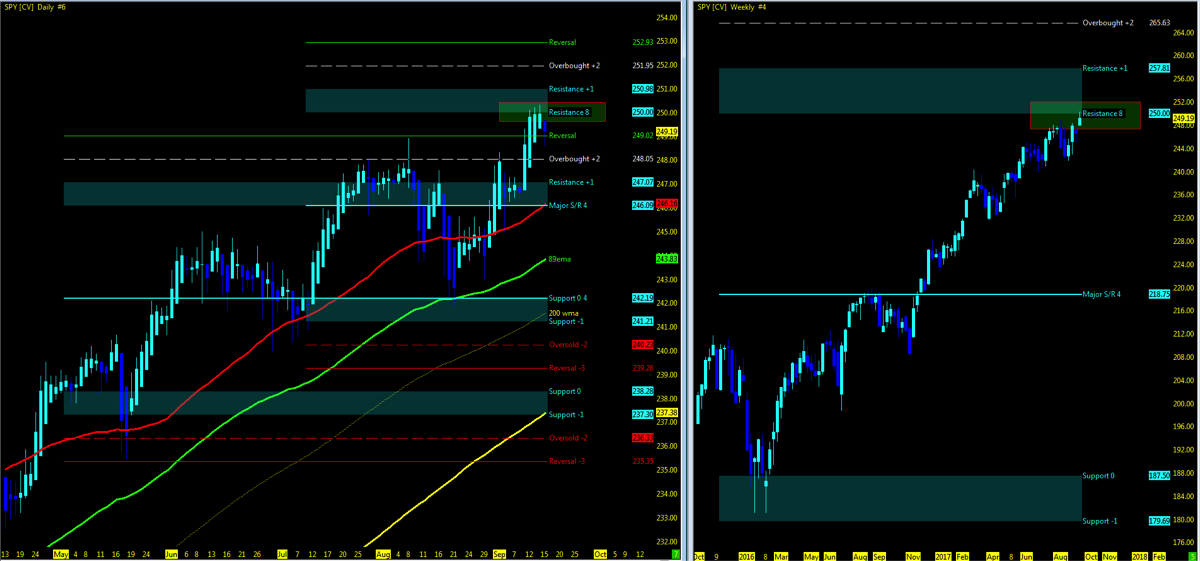
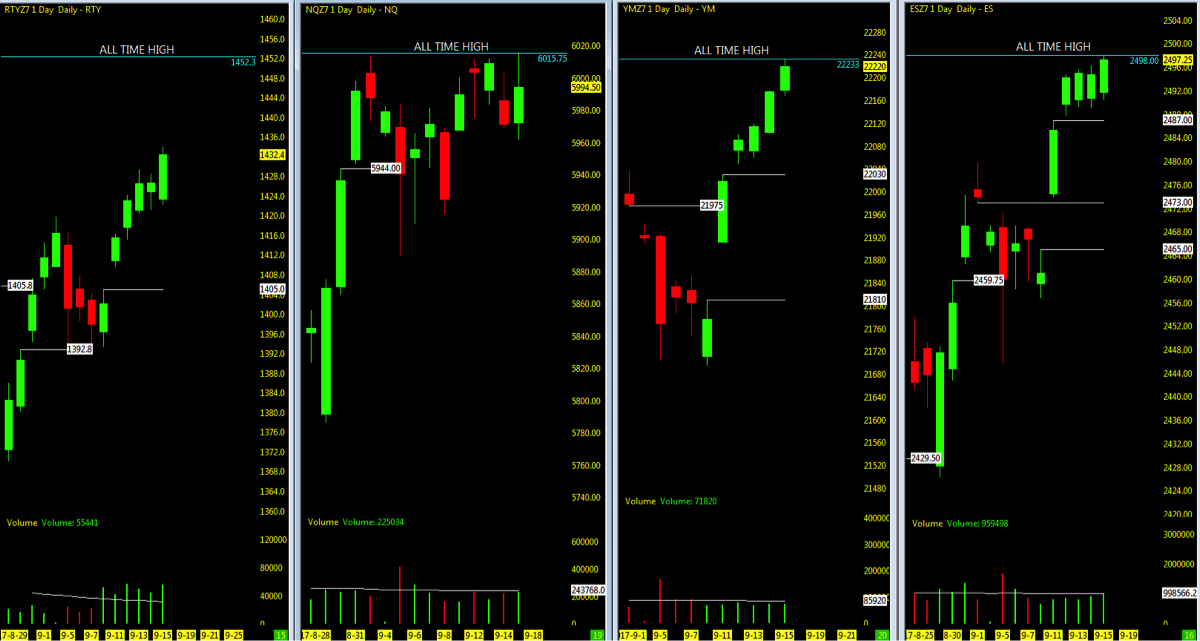
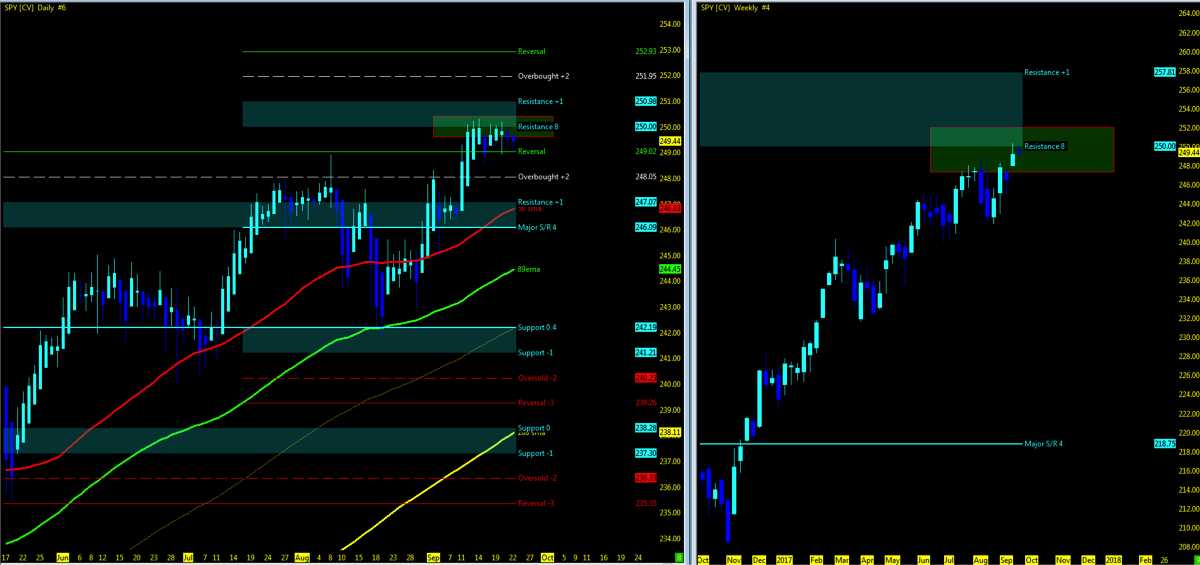
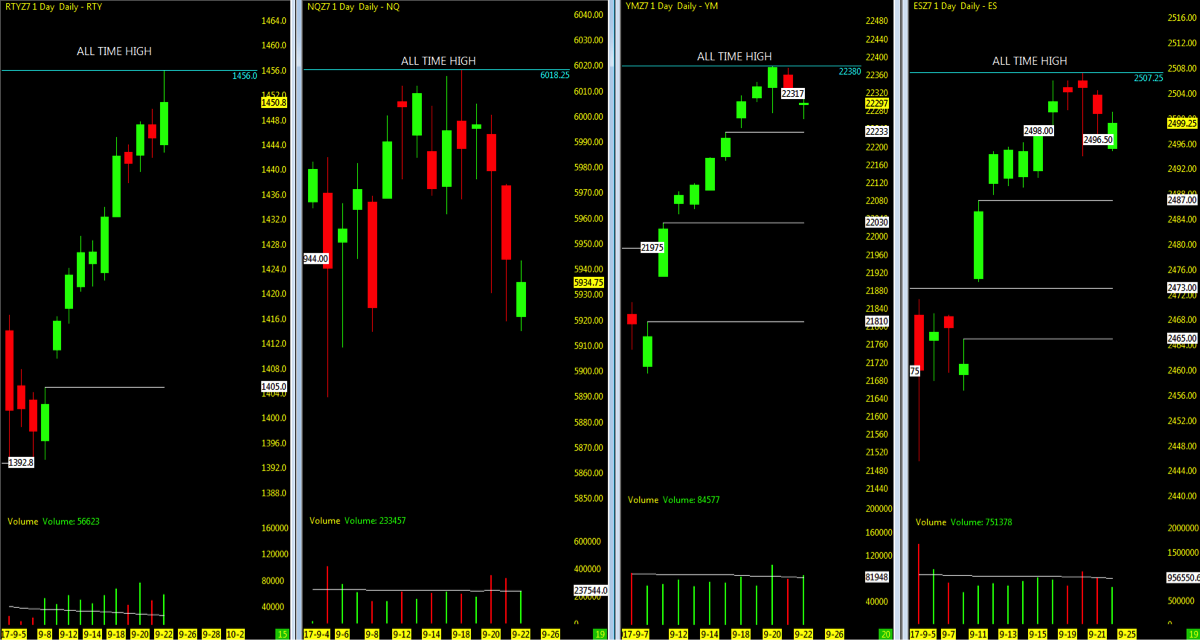
The stock market indices continue to show strength with the Nasdaq (INDEXNASDAQ:.IXIC) soaring to new all time highs in week 18 and the S&P 500 (INDEXSP:.INX) reaching new weekly closing highs.
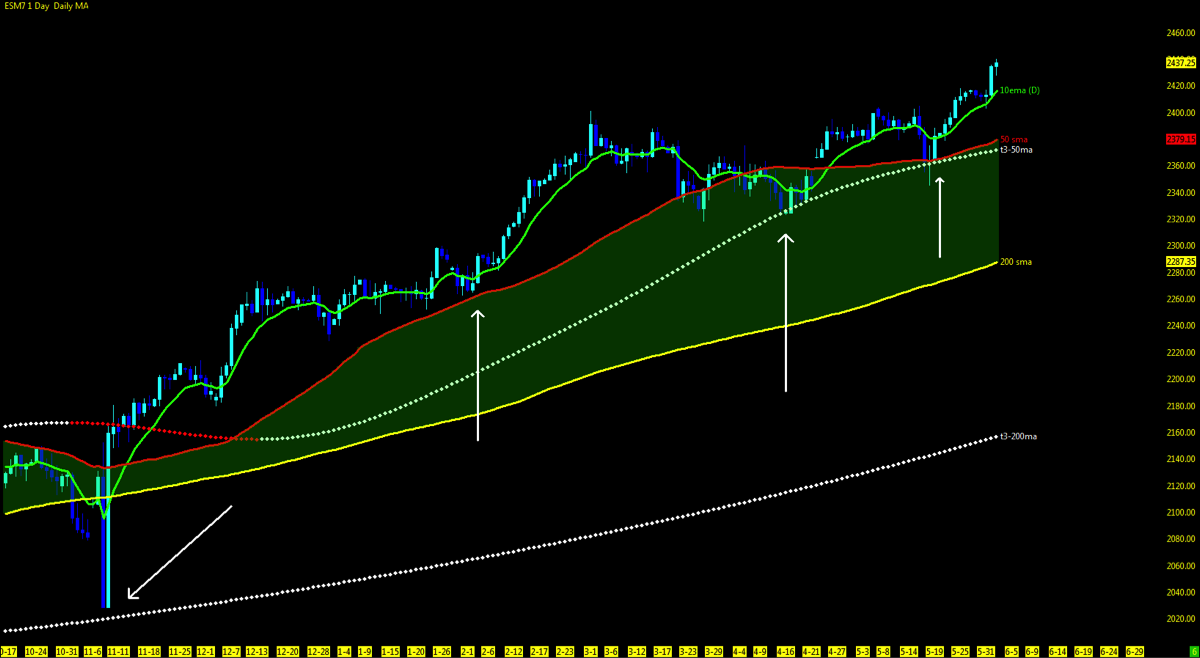
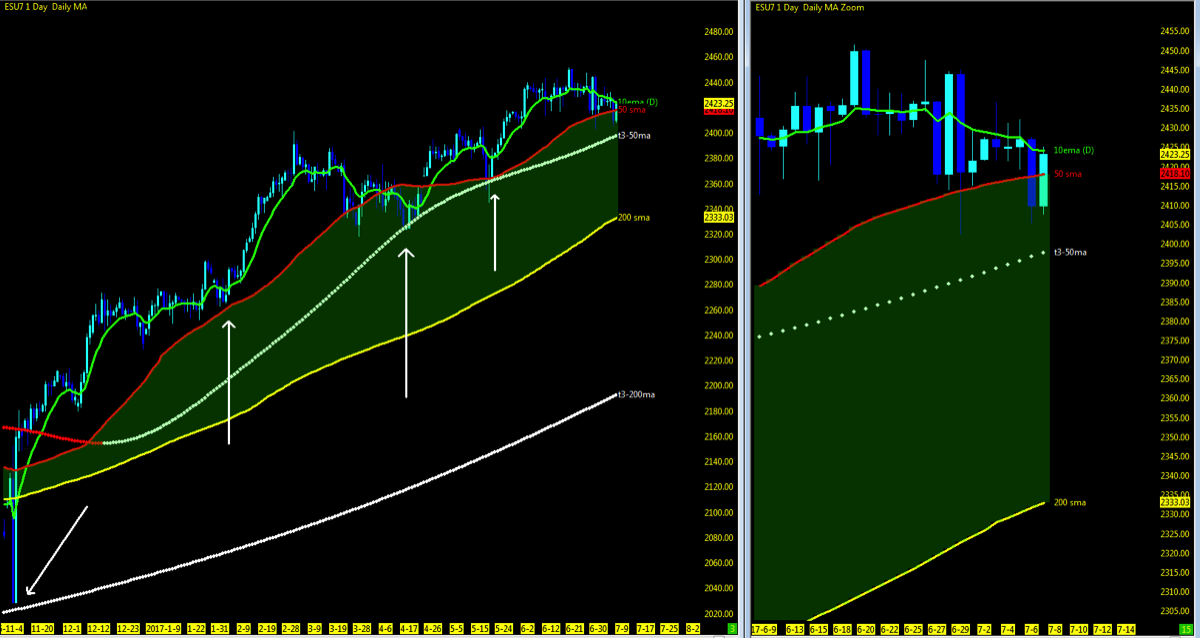
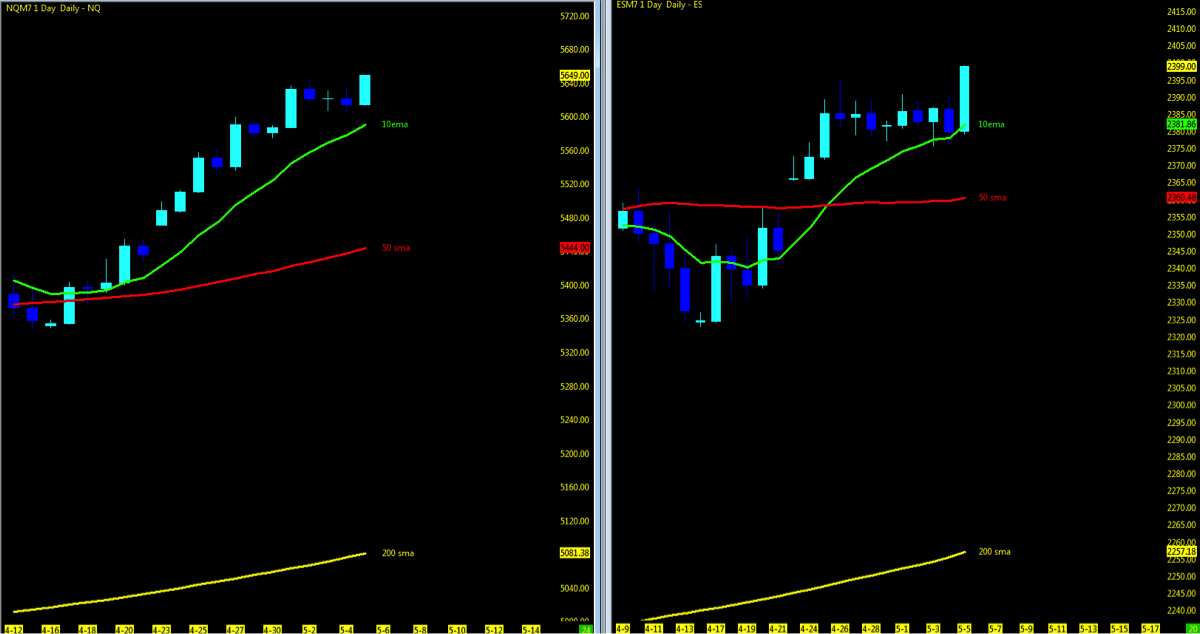
Market futures for both indices maintain its relentless uptrend, holding above the short term 10 and mid-term 50 period moving averages.
Last week: “With price action now back above the 10/50 ma’s, attention on the ES and YM turn to the all time highs seen back in March.”
Mission accomplished for 2 or 3 indices.
The VIX Volatility Index closed out the week with a 10 handle after dipping into the 9’s earlier in the week! But the stock market found its footing and grew some legs by the end of the week to regain new all time highs and regain a high on the S&P 500 futures not seen since March, 2017. Perhaps no raise in the interest rates by the Fed Reserve, health care vote passing and non-farm payrolls exceeding expectations appeared to be enough for price action to continue to maintain momentum above the 10 period moving average and well above the 50.
As Danny Riley states, “these are not our father’s markets.” Rightfully so, however if you want to play in the sandbox, you need to adapt and get your mindset in the game. The game of realize that we continue to technically be in an uptrend and leaving your bias at the door, you may be open to seeing the charts differently.
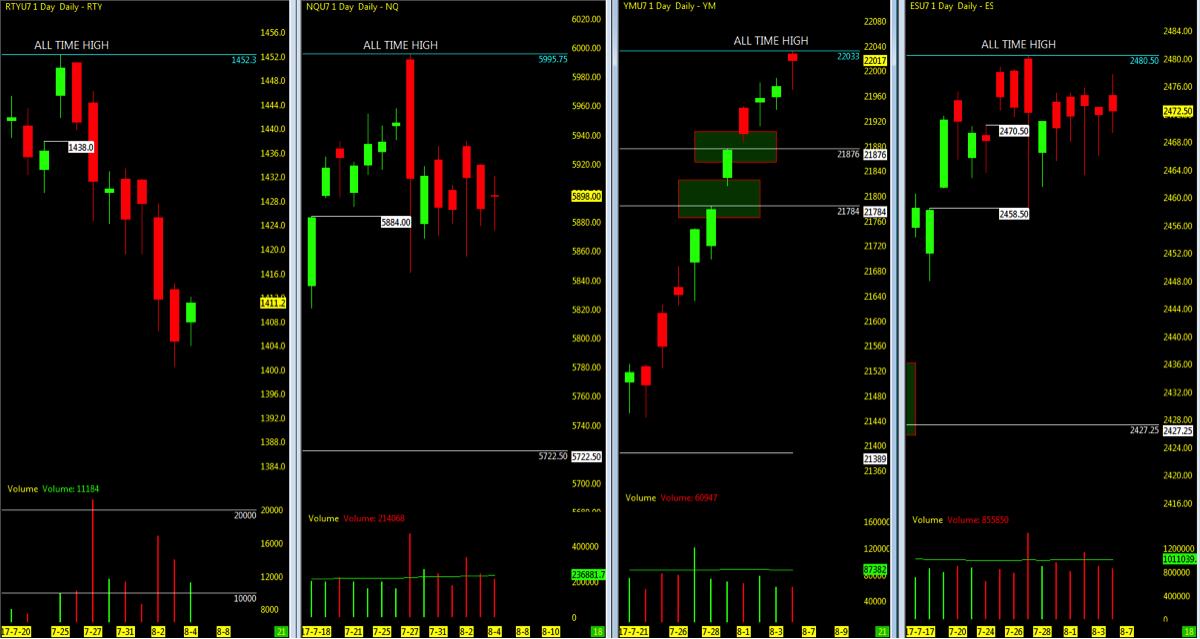
The NQ (Nasdaq futures) appears at this point to leading the indices as the economic data out of the FANG stocks overall seem strong. The elephant in the room is that volume at week’s end was dismal. While intraday trend doesn’t necessarily need volume, in the big picture it is something that should be noticed to watch for follow through in the days to come.
Key events in the market this week include FRENCH ELECTIONS on Sunday and post results. Minor events include JOLT’s, Earnings winding down and Multiple Fed Speakers… and throw in Washington politics, economic reform and world instability for good measures.
Technical momentum probability REMAINS in a UPTREND on the bigger picture. Signs of market strength continue as the NQ pushed to all time highs on post data. Beware of the catalyst wrench that looms overhead.
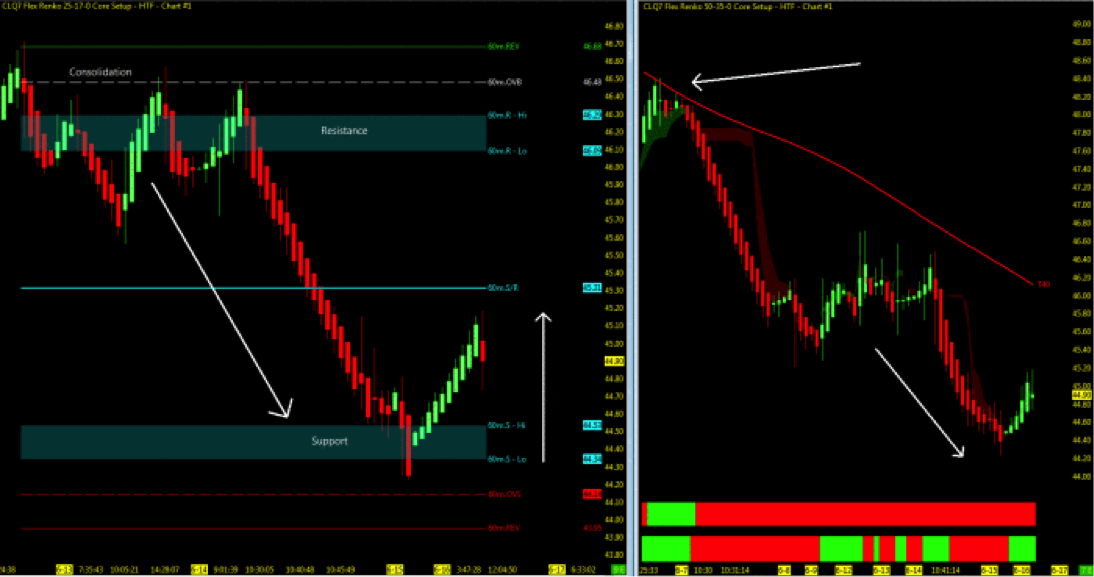
Note that you can also view my market outlook on YouTube. Markets Covered: ES, YM, NQ, GC, CL
Attempting to determine which way a market will go on any given day is merely a guess in which some will get it right and some will get it wrong. Being prepared in either direction intraday for the strongest probable trend is by plotting your longer term charts and utilizing an indicator of choice on the lower time frame to identify the setup and remaining in the trade that much longer. Any chart posted here is merely a snapshot of current technical momentum and not indicative of where price may lead forward.
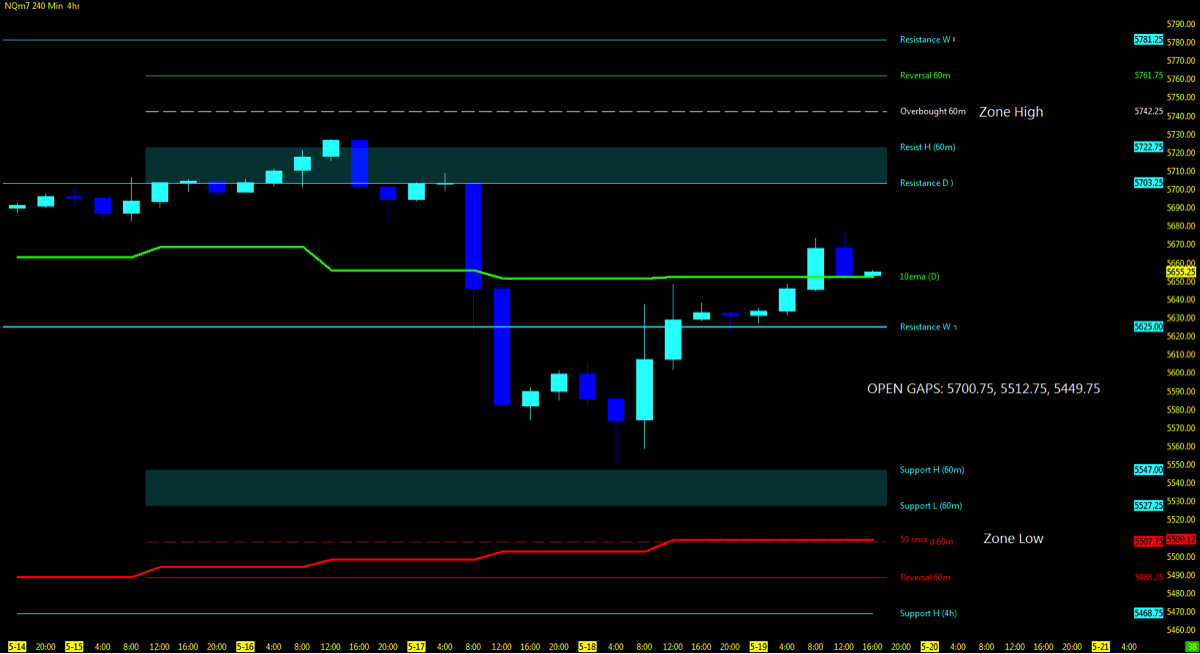
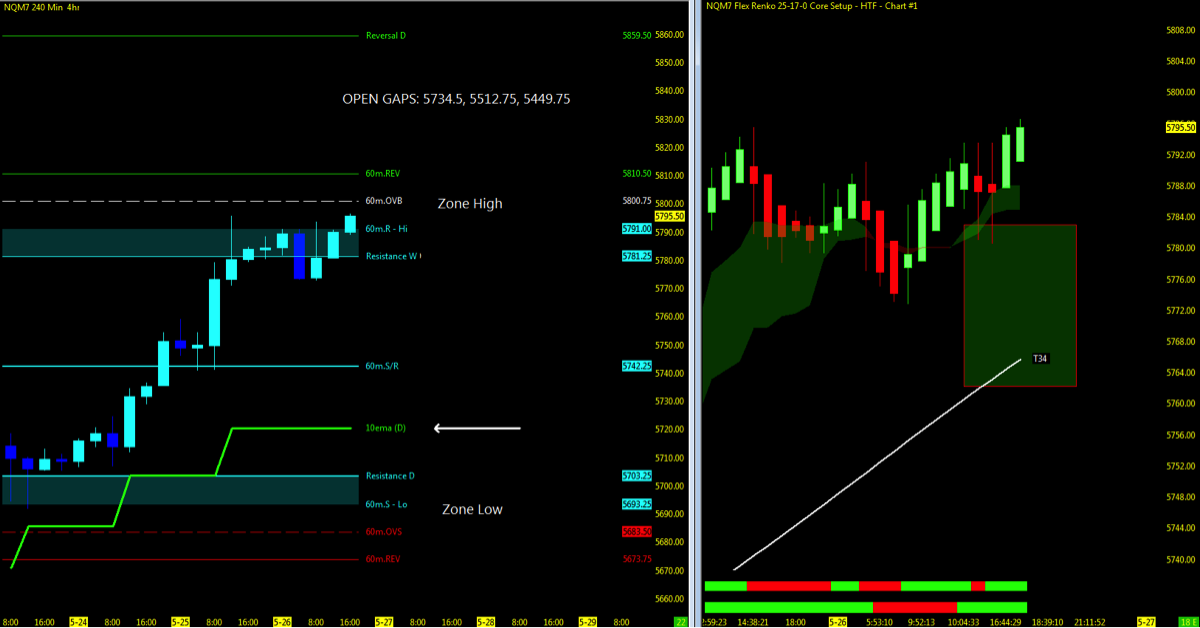
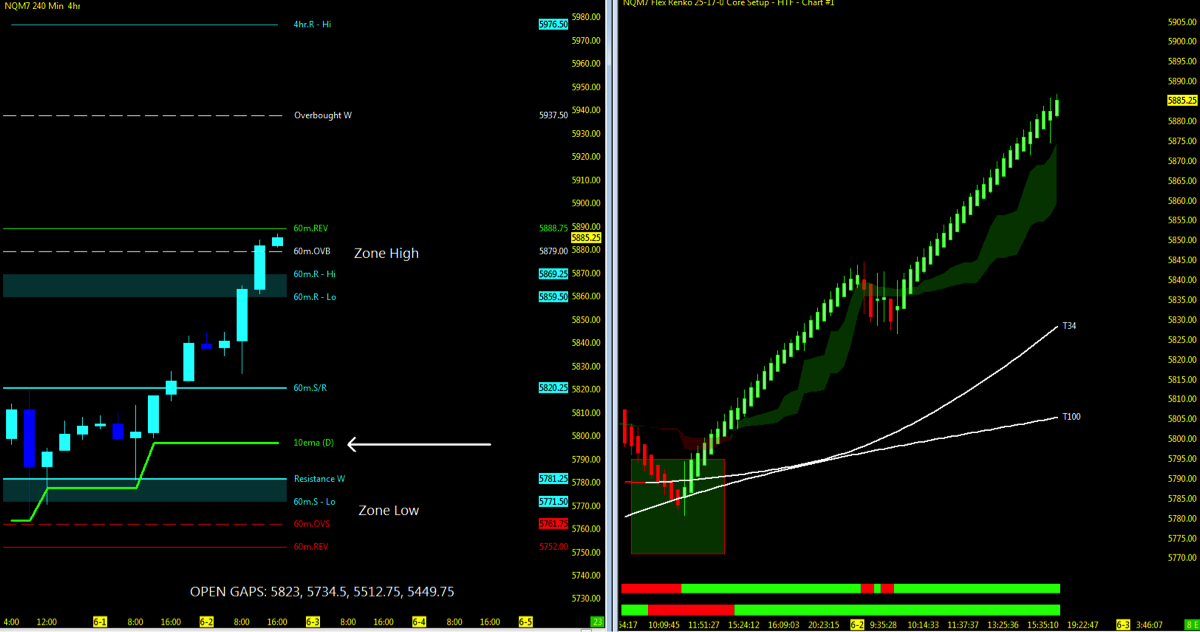
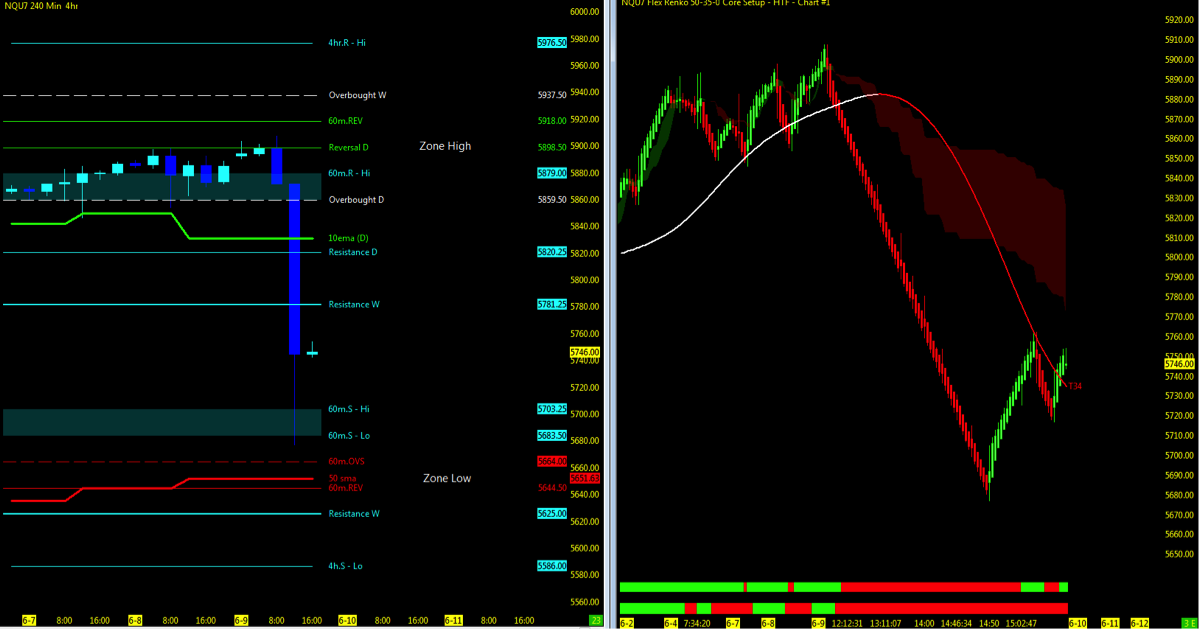
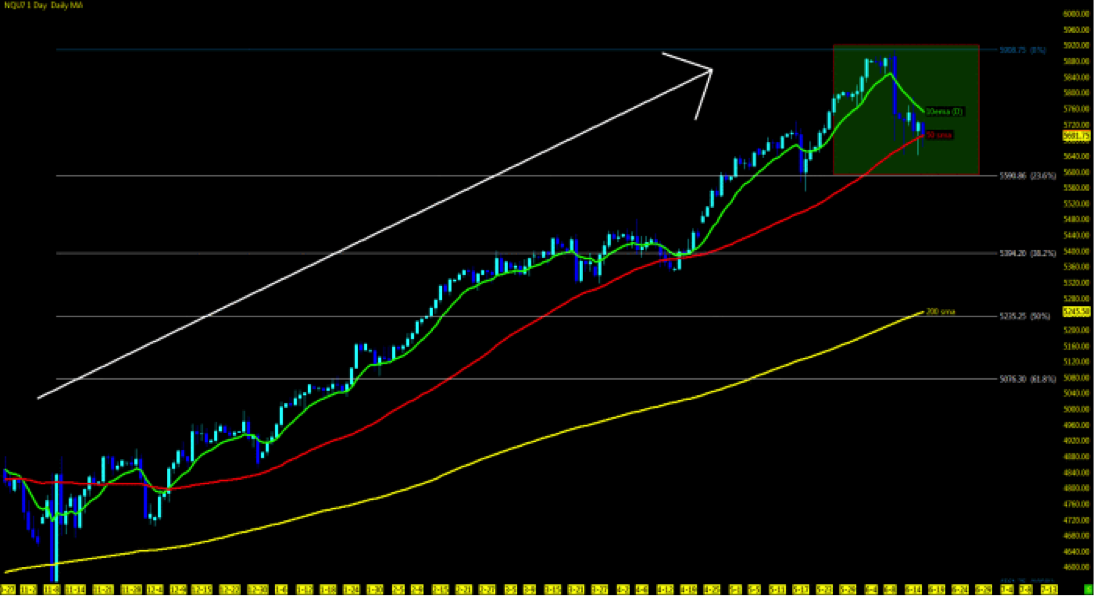
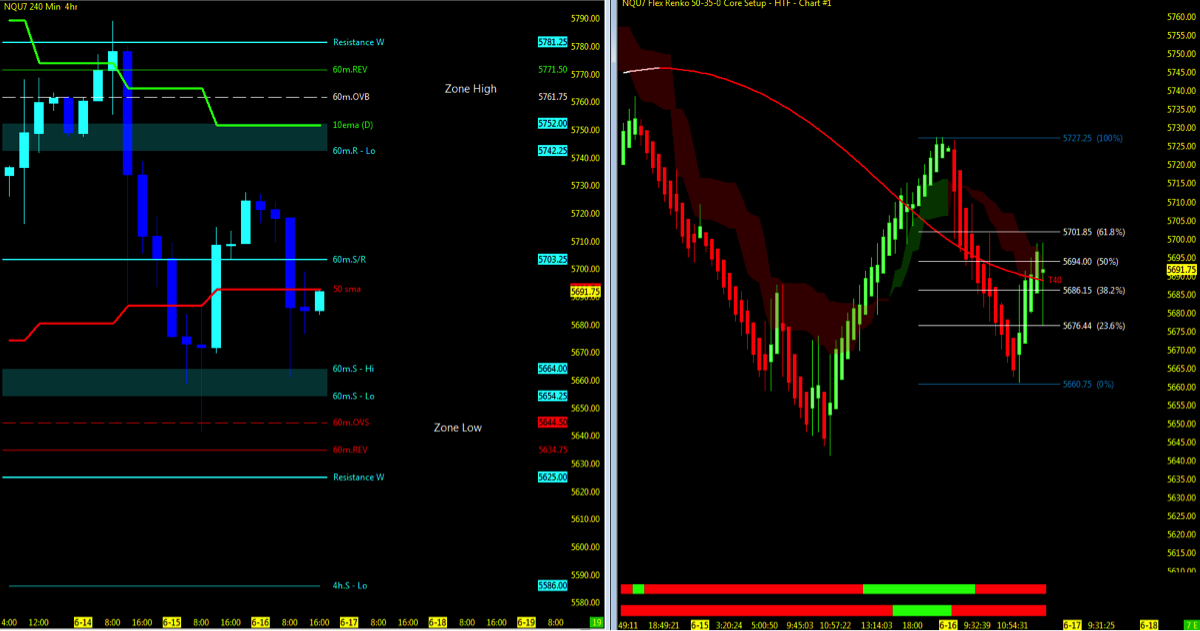
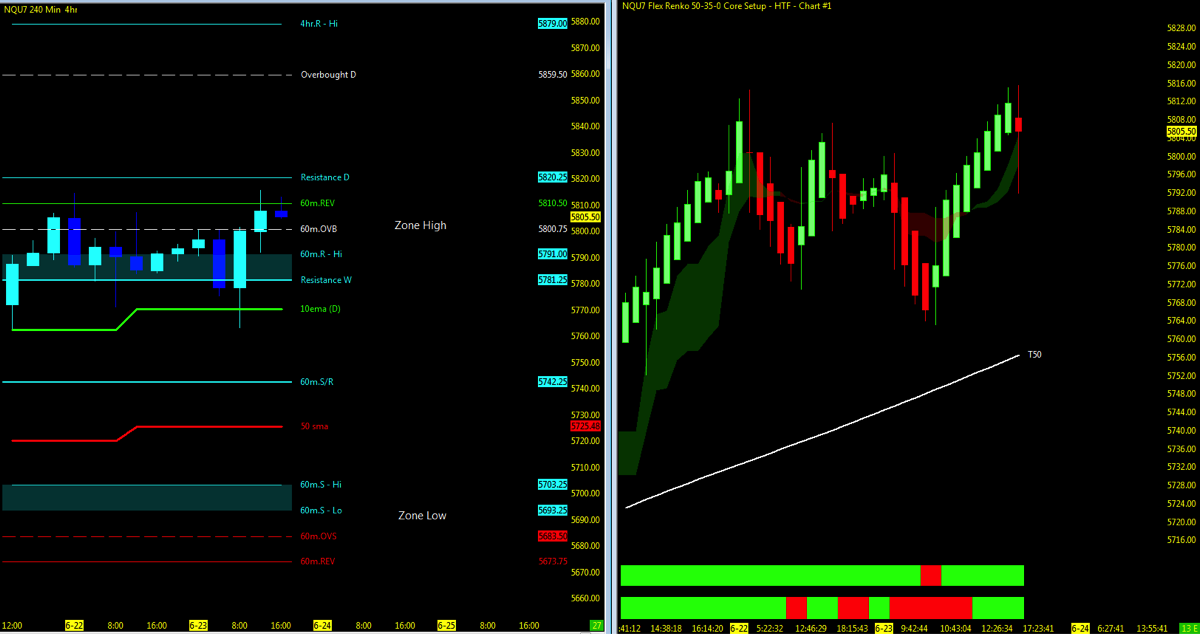
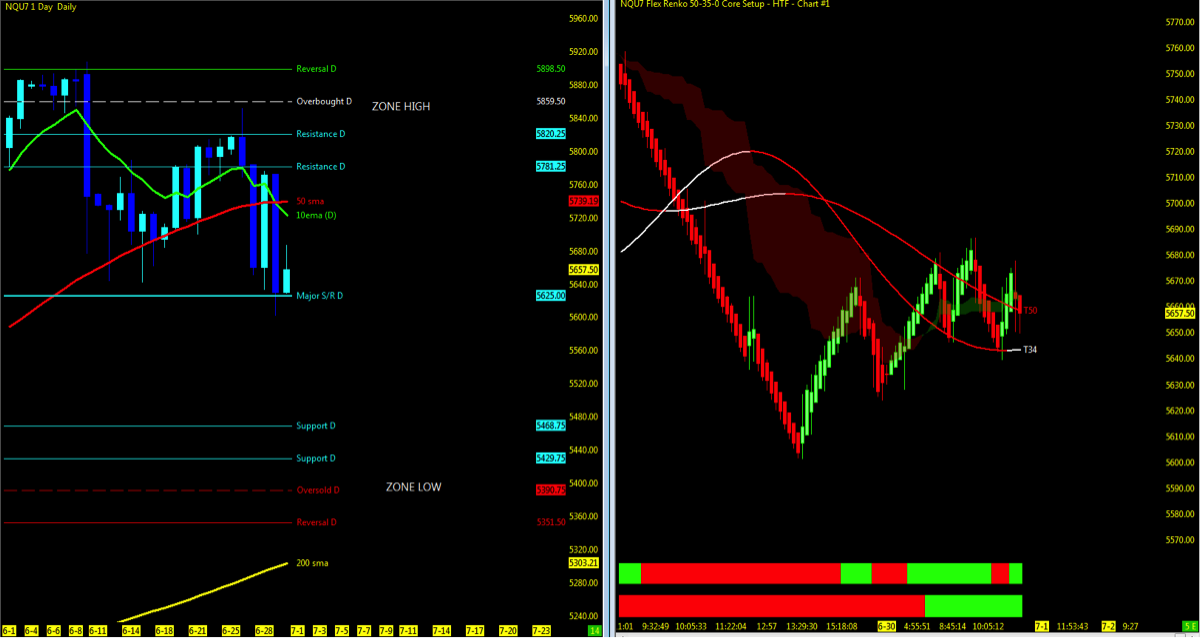
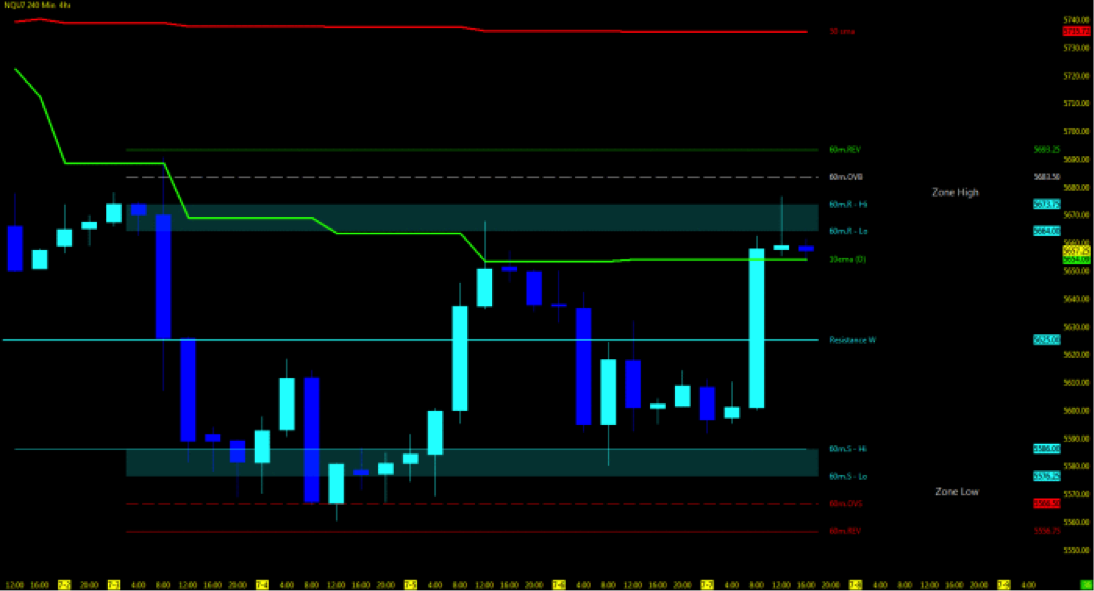
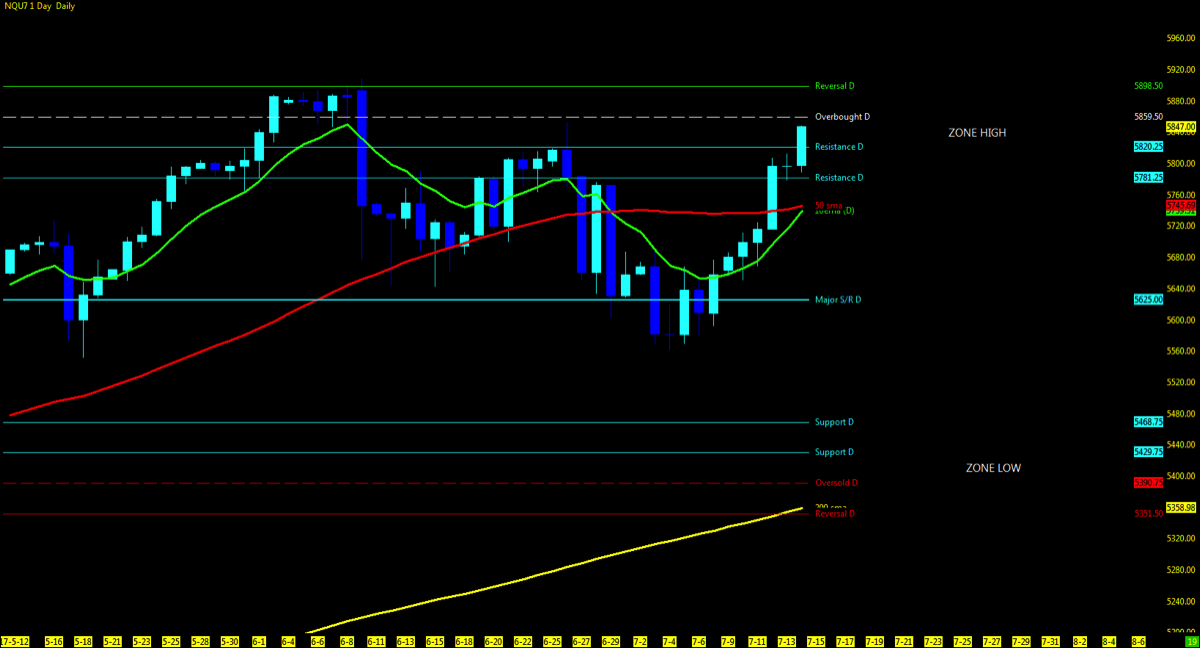
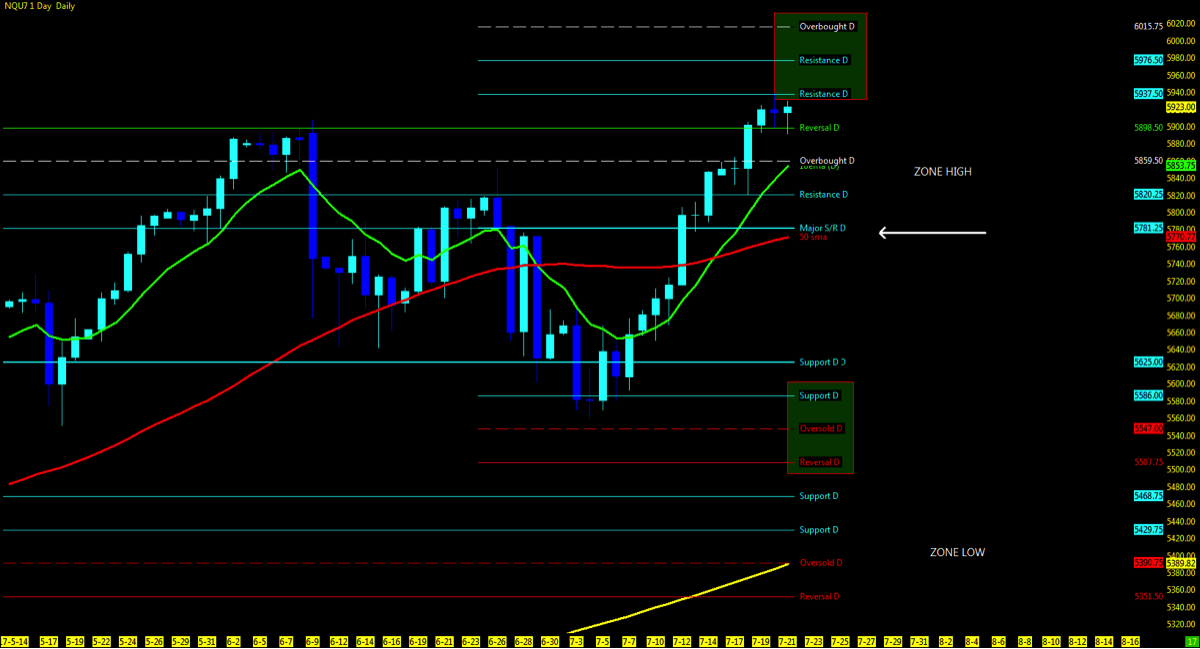
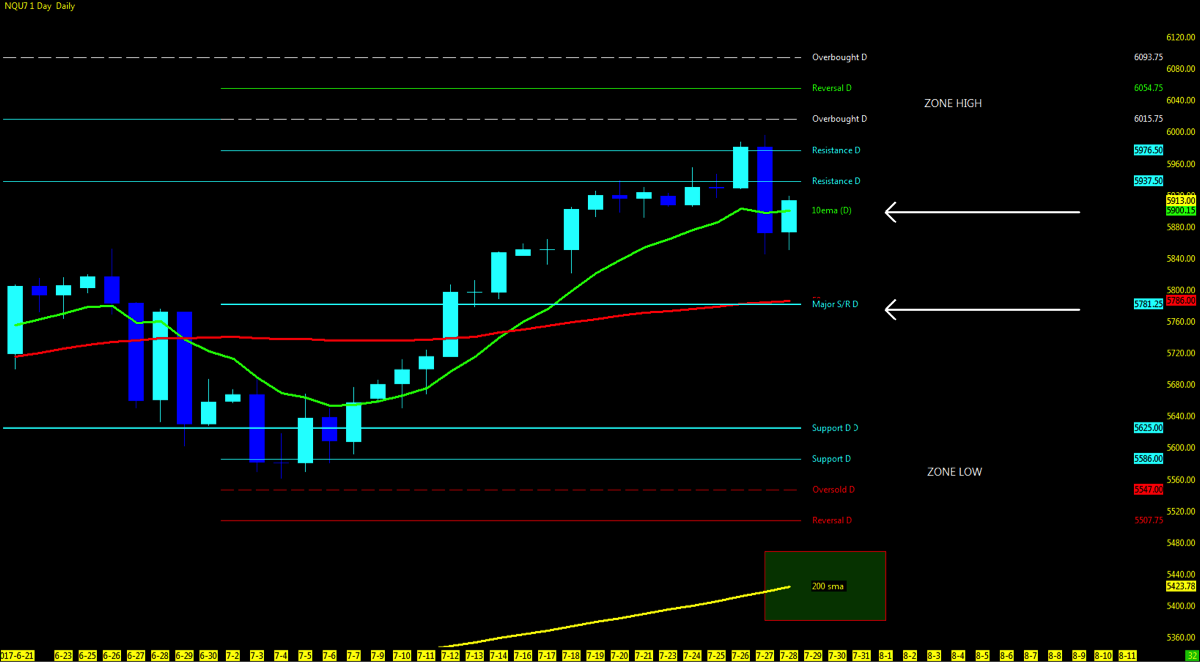
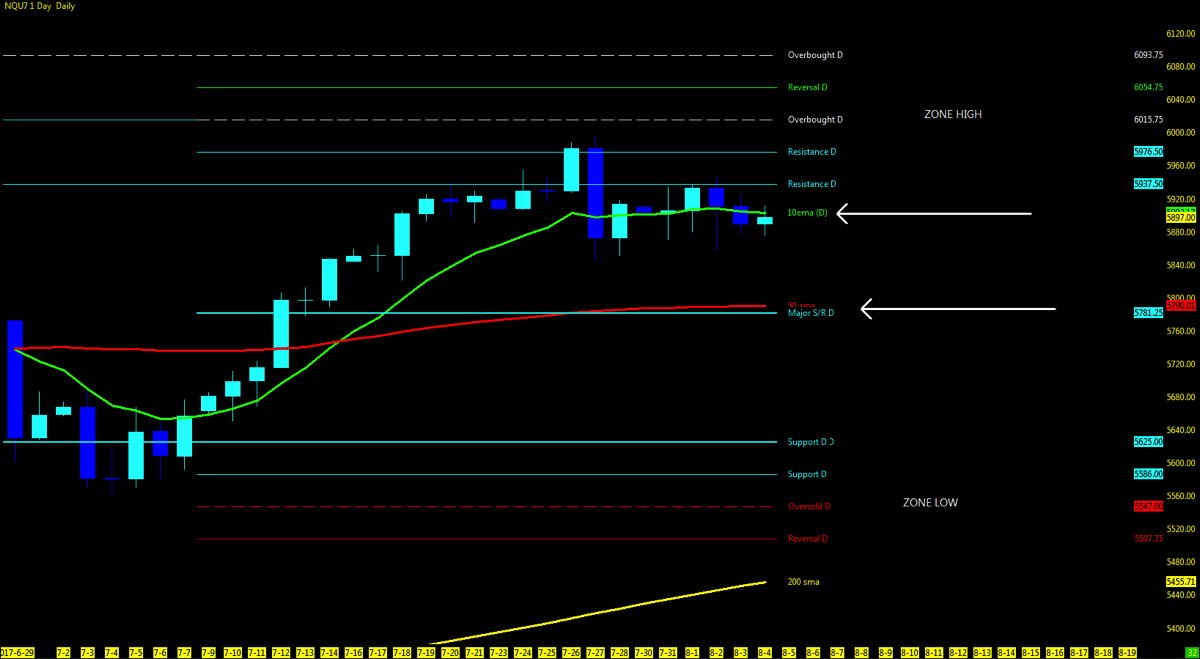
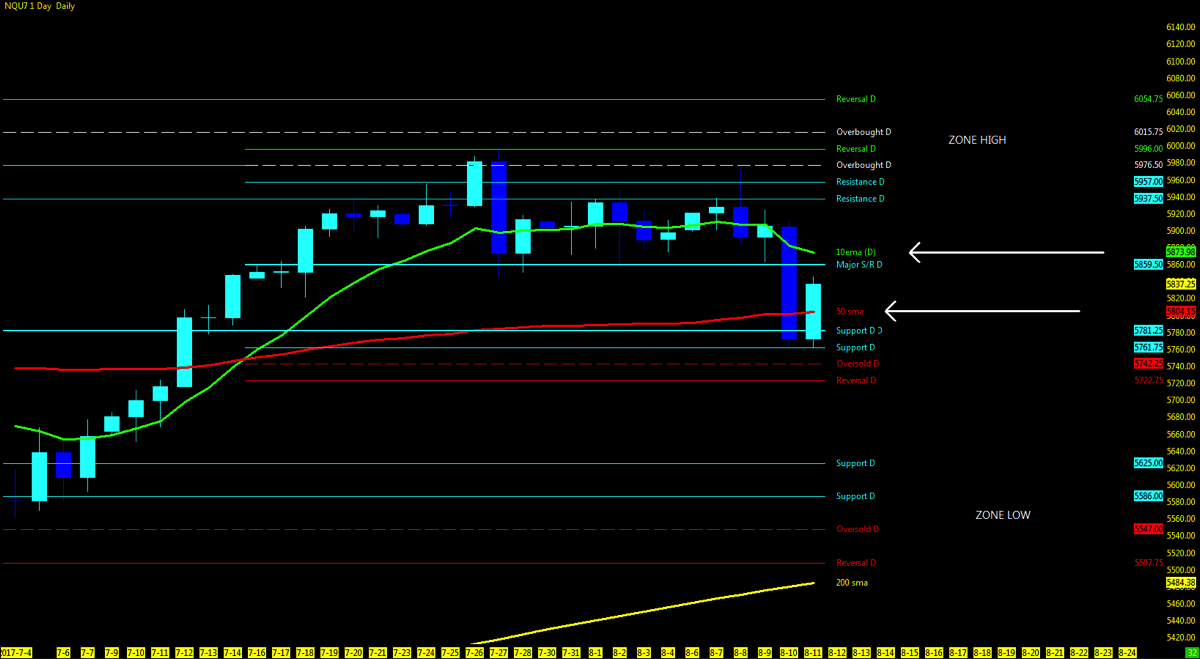
NQ – NASDAQ FUTURES
Technical Momentum: UPTREND
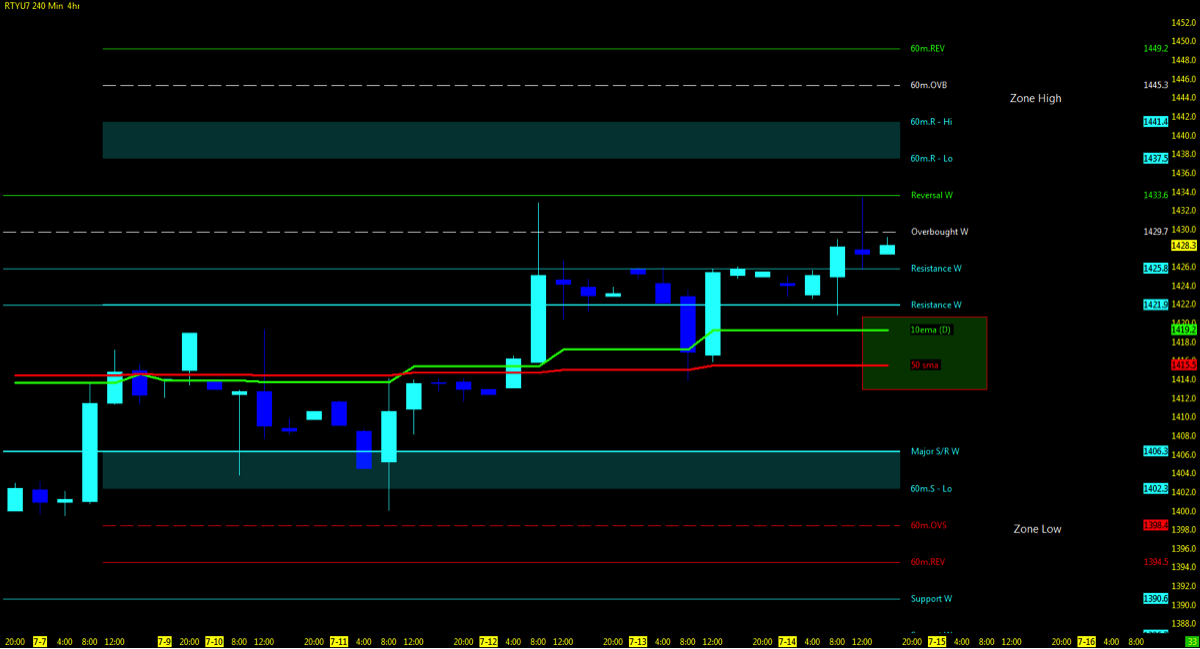
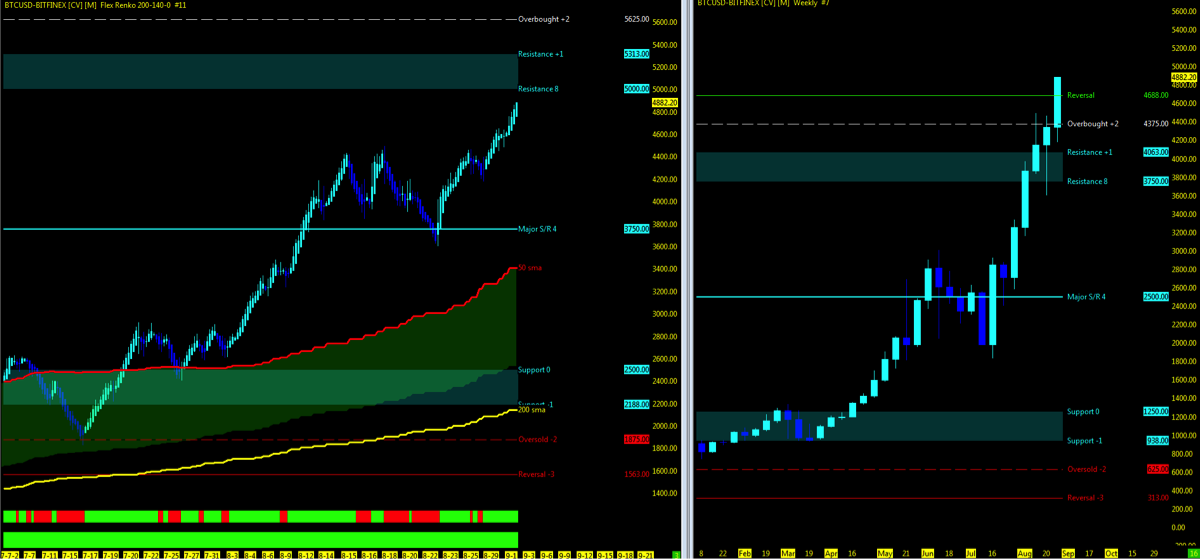
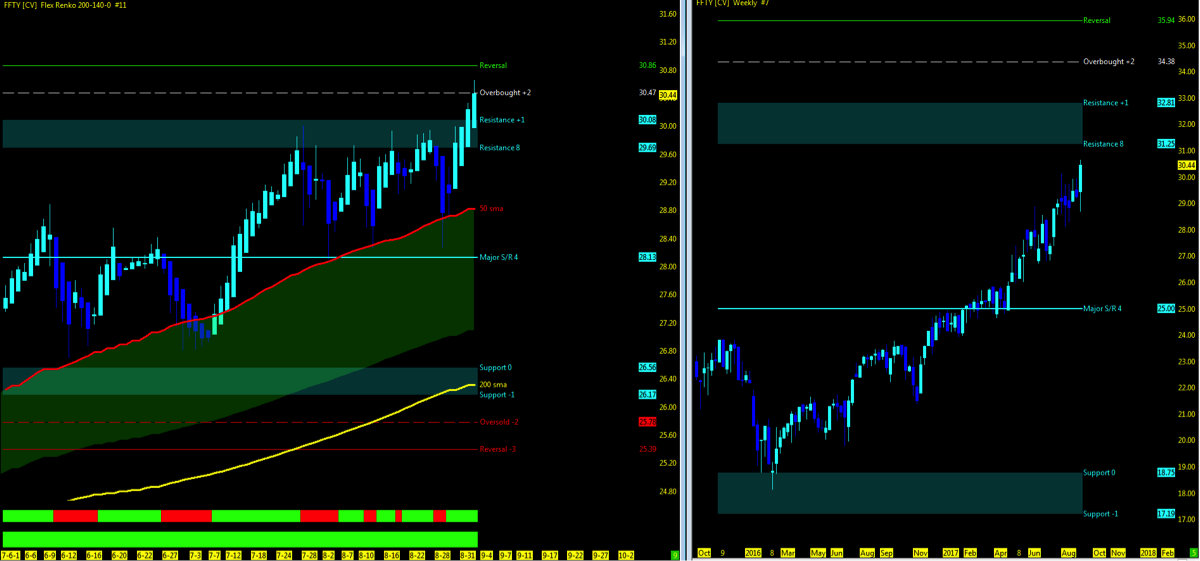
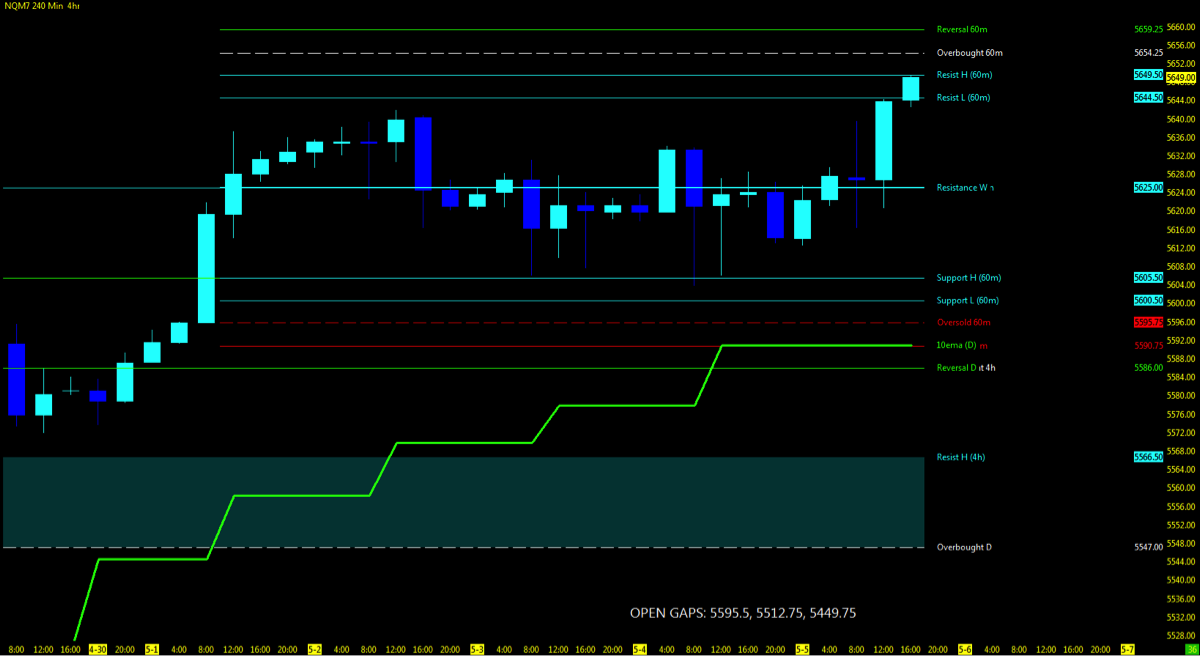
Multiple MML Overlay (4hr with 60m/Daily/Weekly)
* Using the Murray Math Level (MML) charts on higher time frames can be a useful market internal tool as price action moves amongst fractal levels from hourly to daily charts. Confluence of levels may be levels of support/resistance or opportunities for a breakout move.
Nearest Open Daily Gap: 5595.5, 5512.75, 5449.75
Lowest Open Gap: 4017
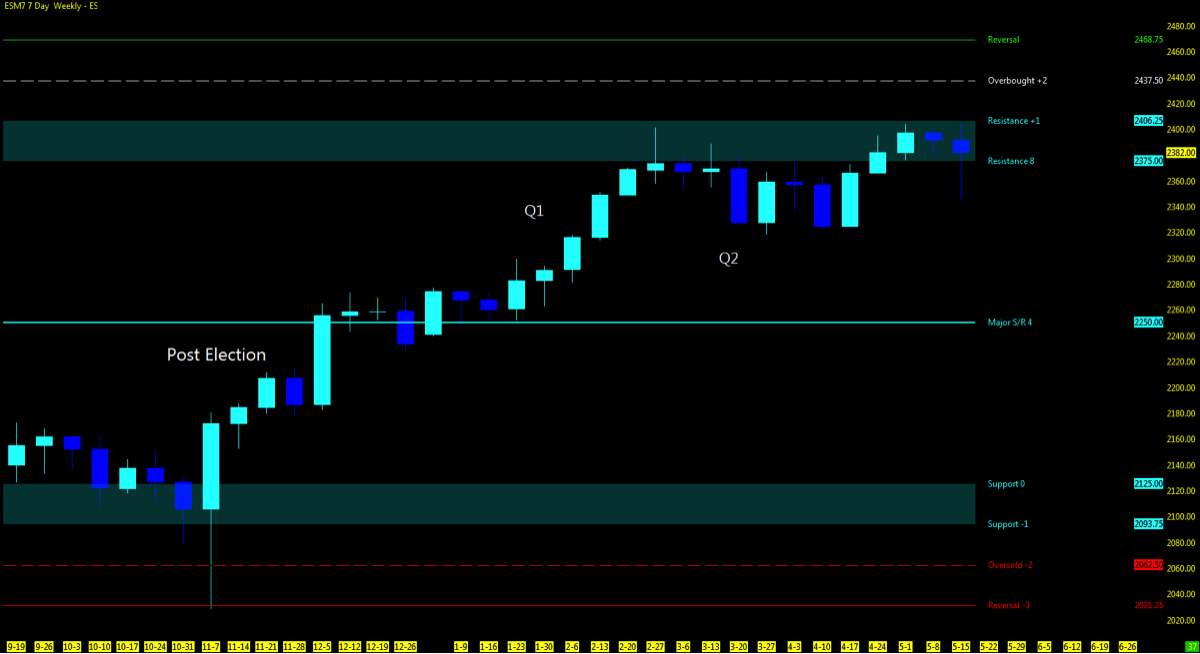
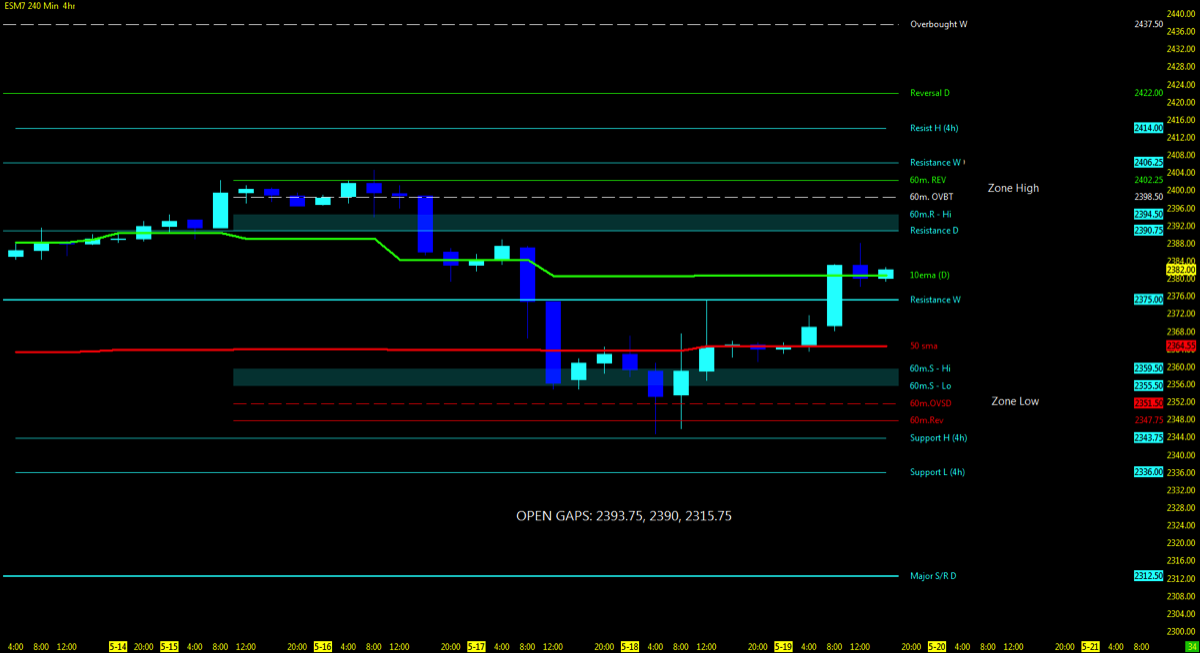
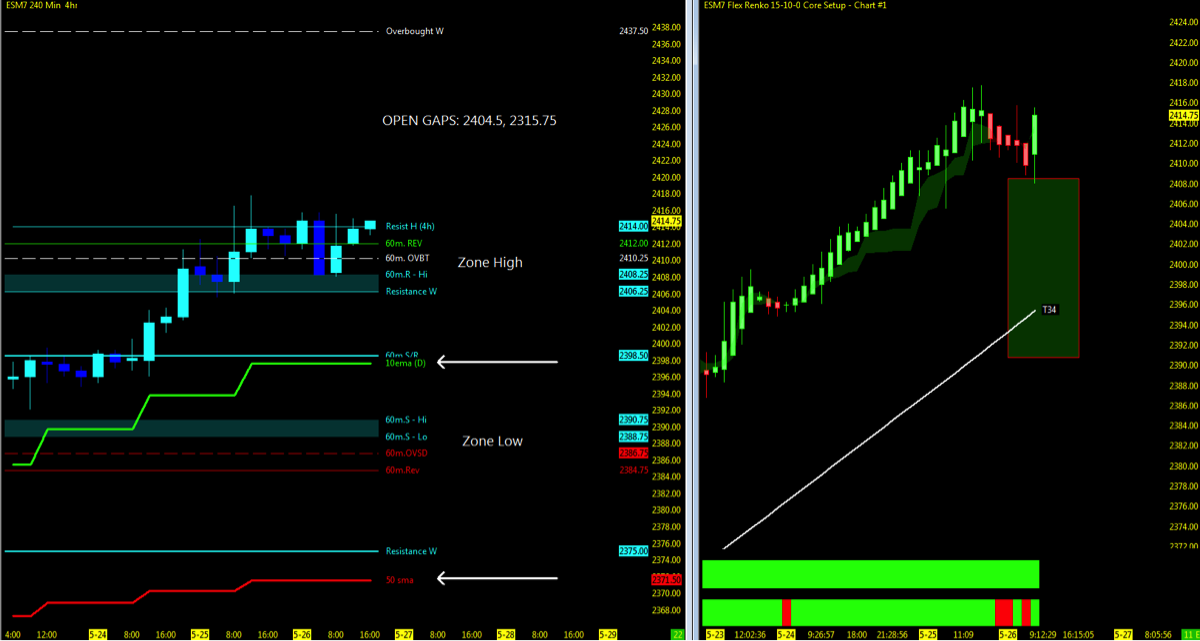
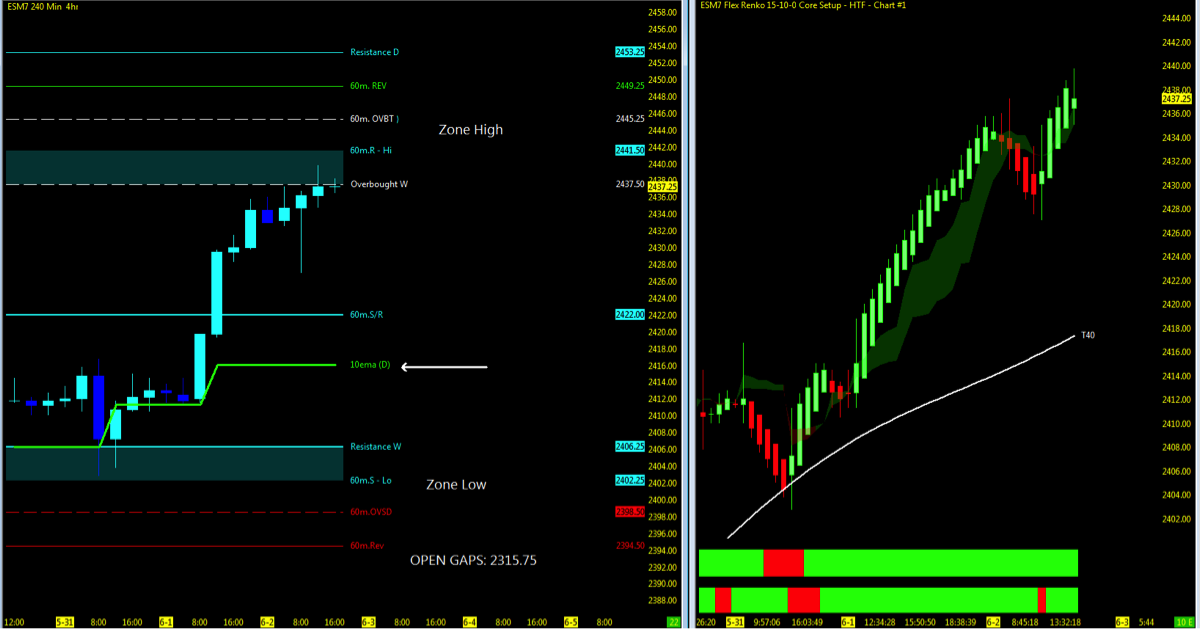
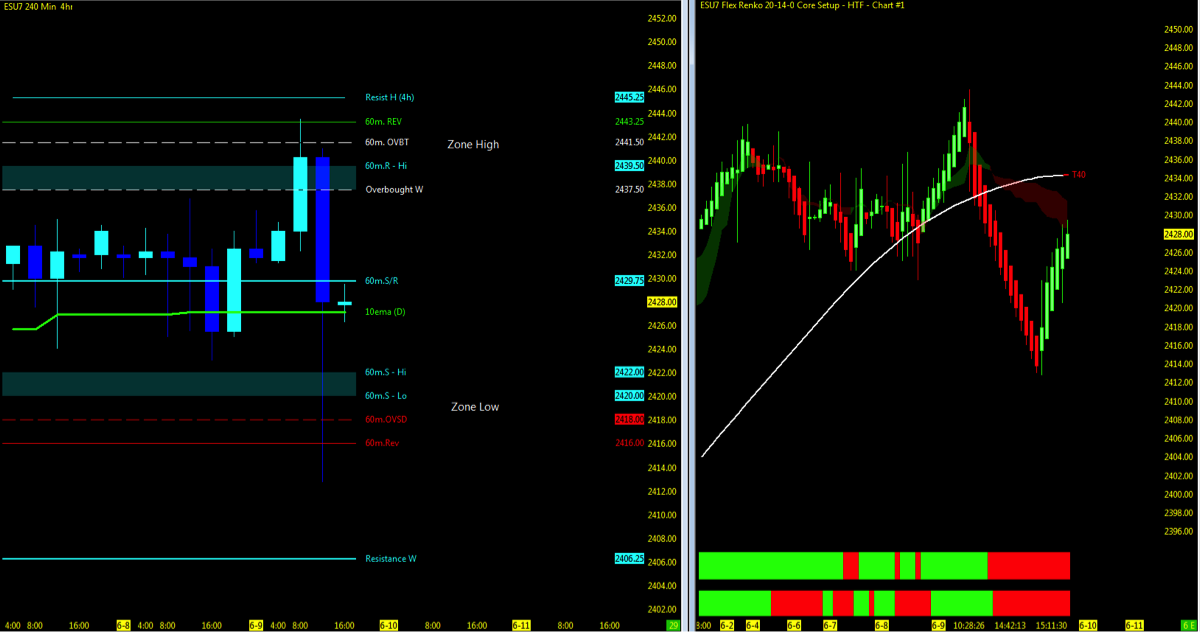
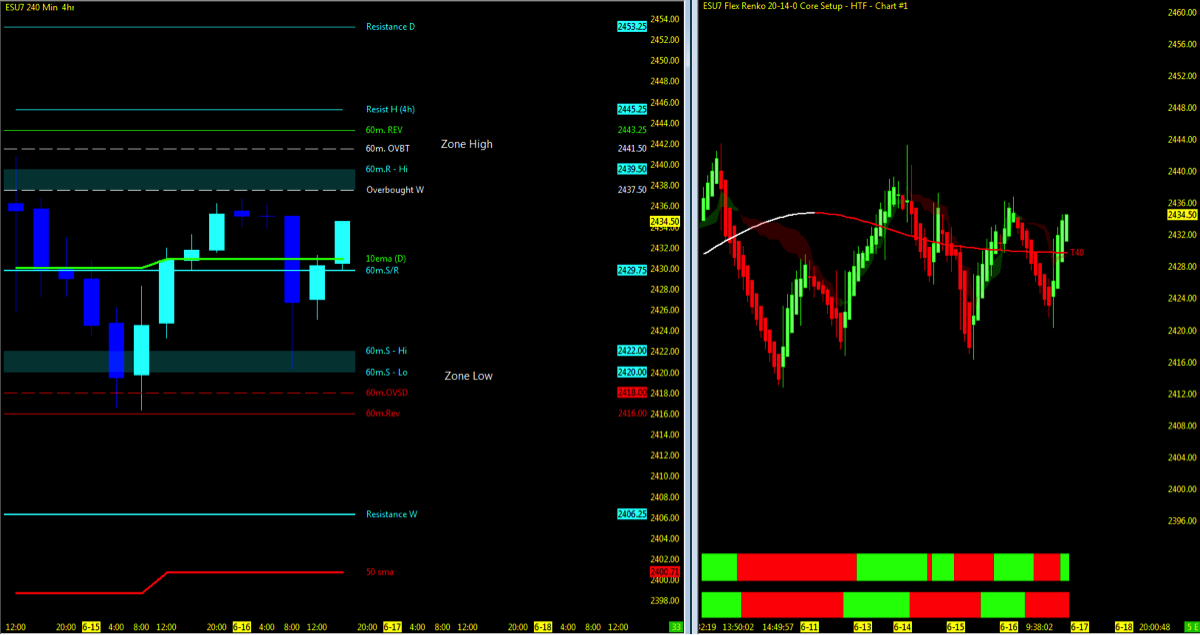
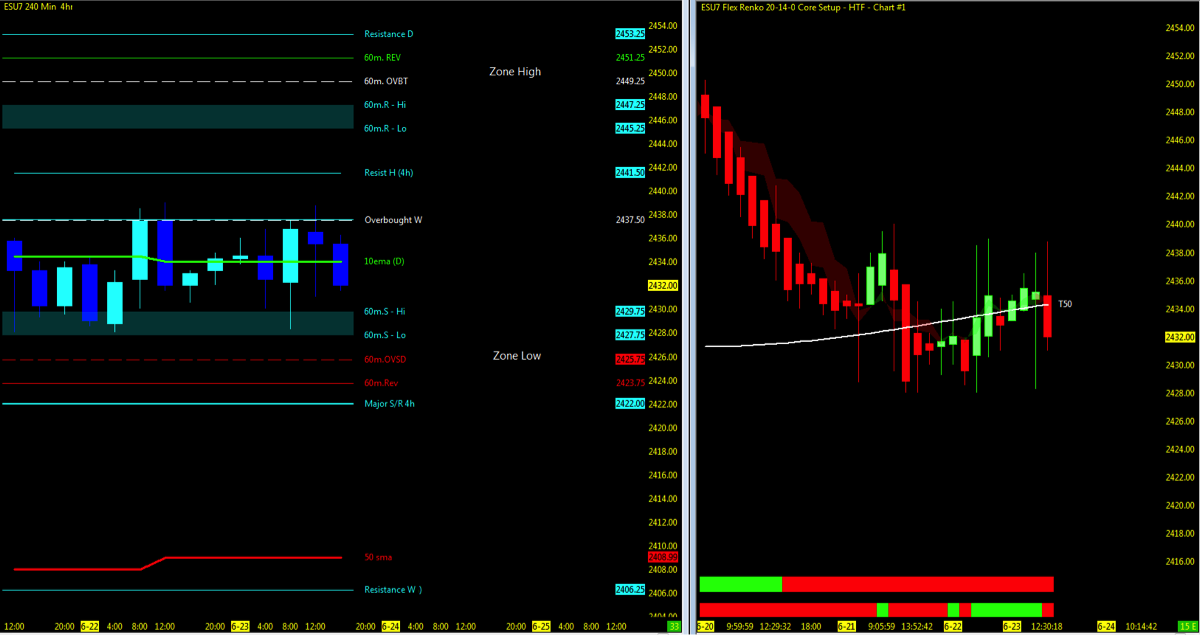
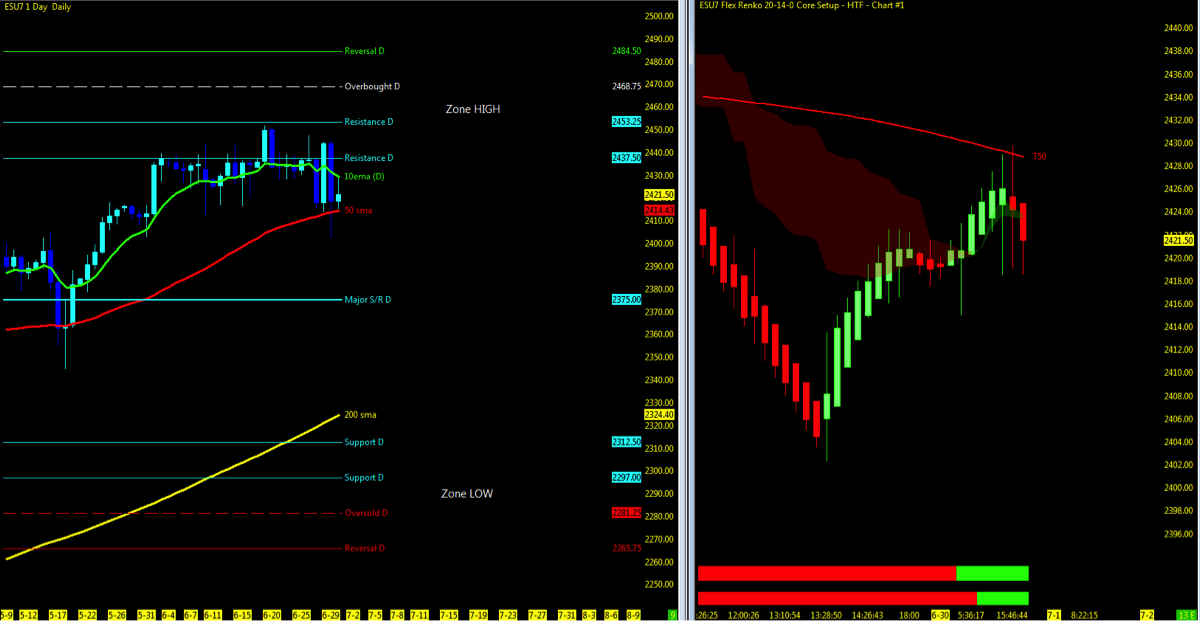
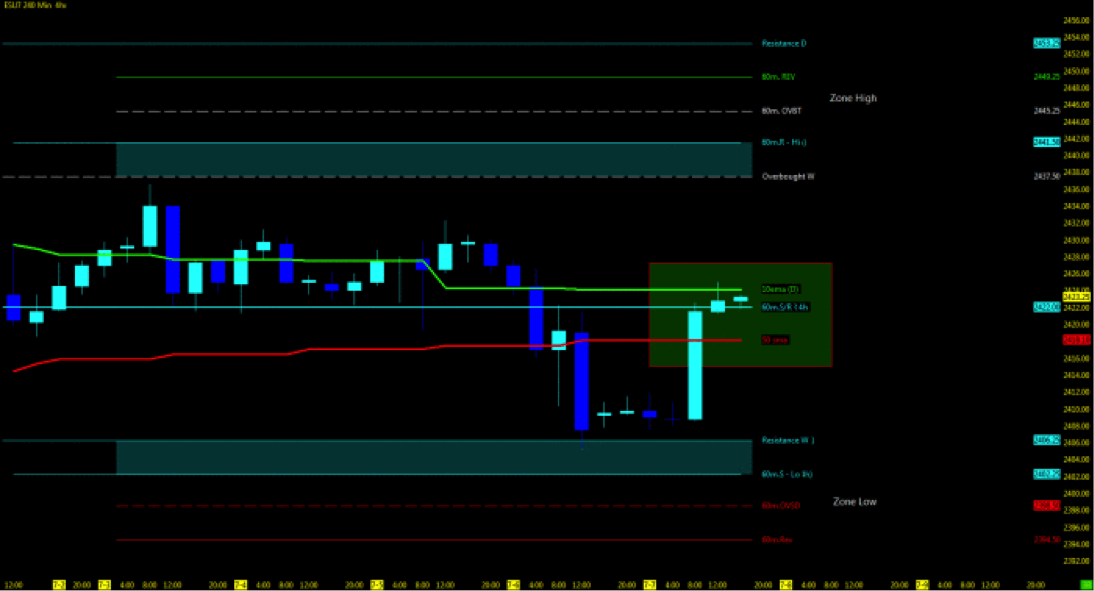
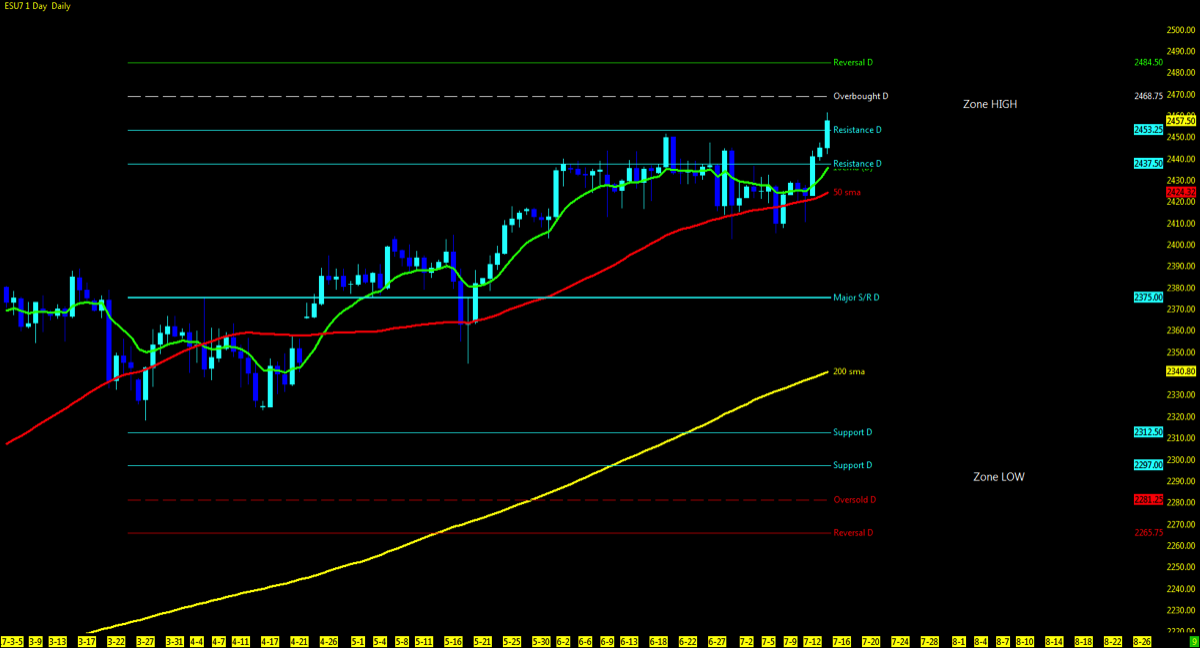
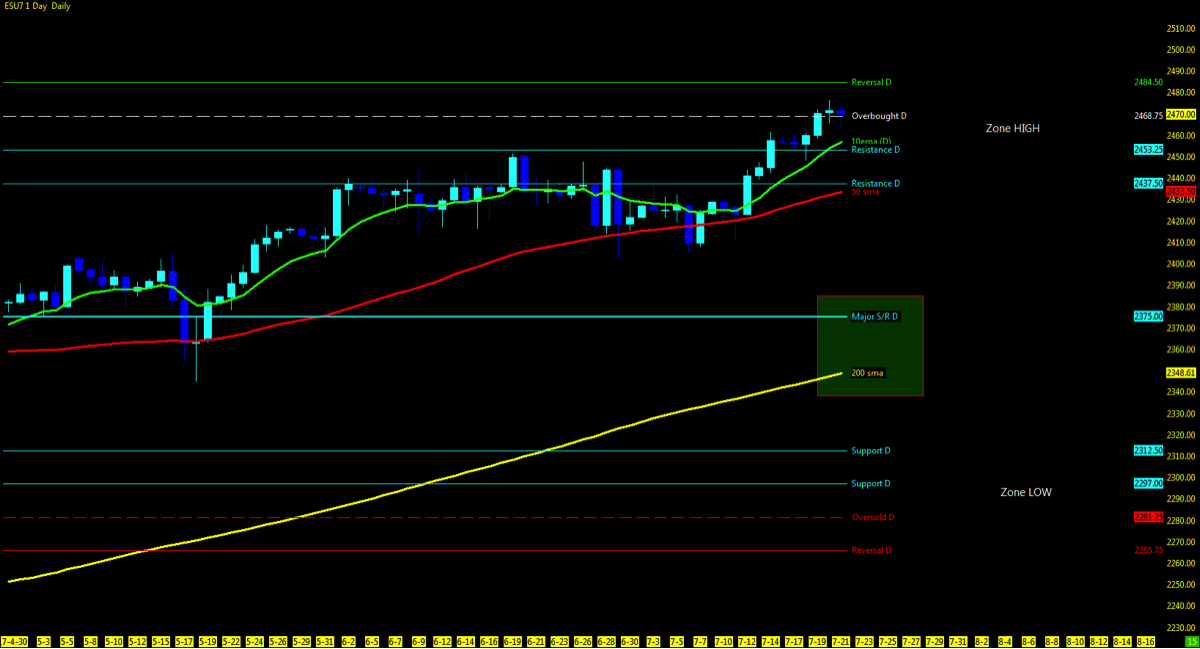
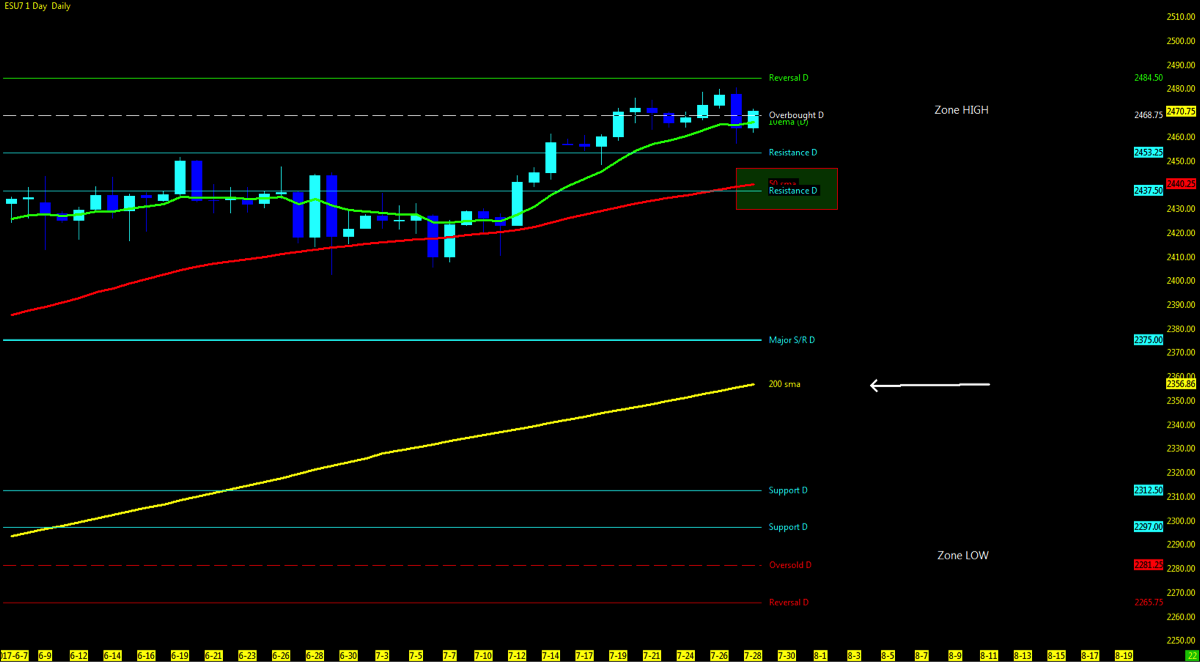
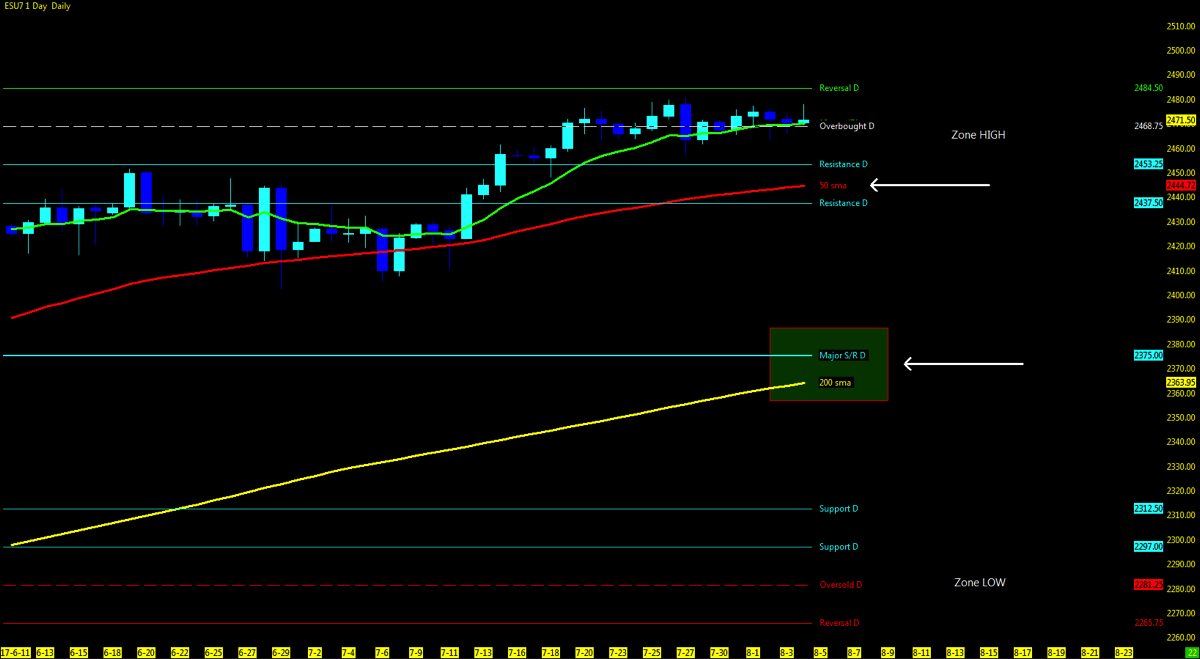
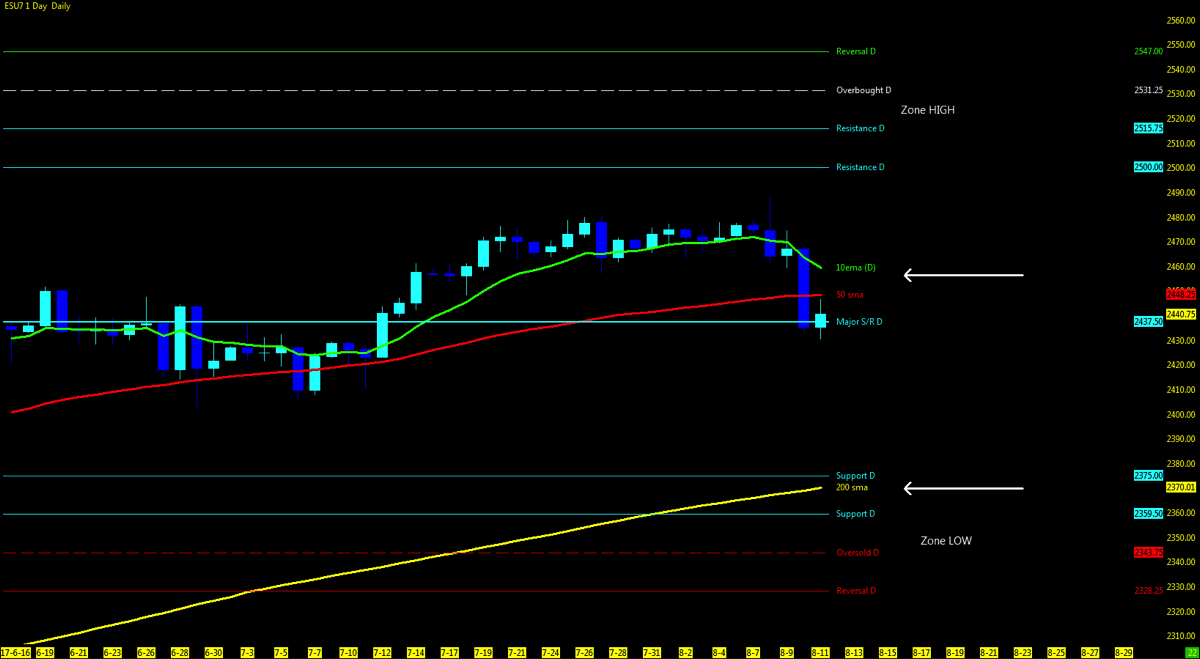
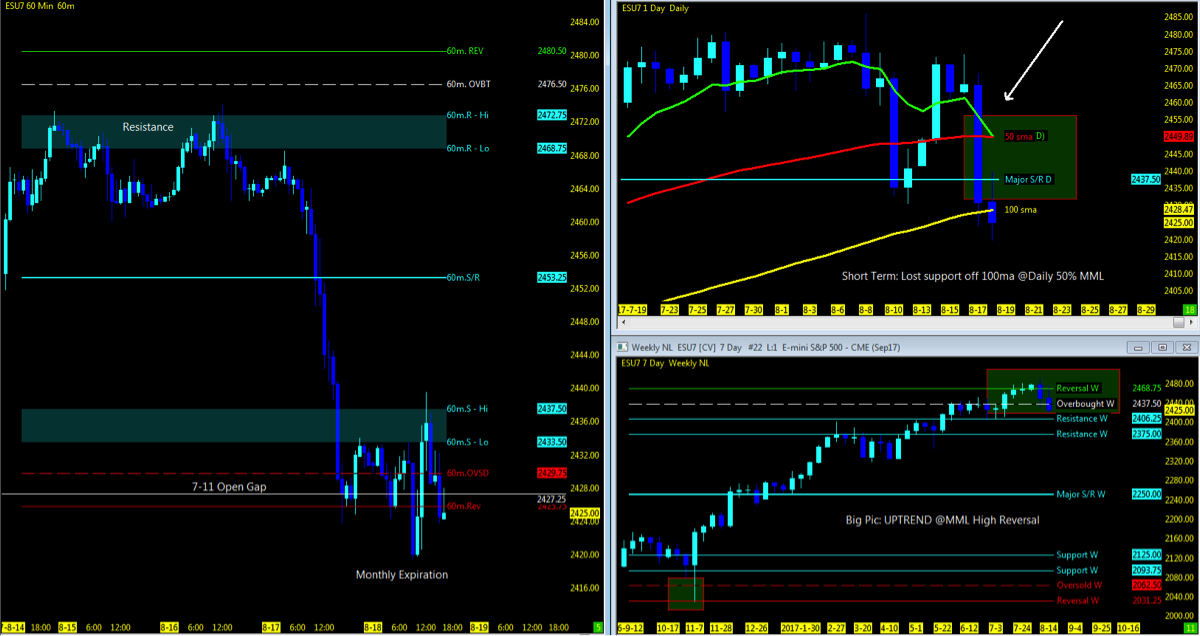
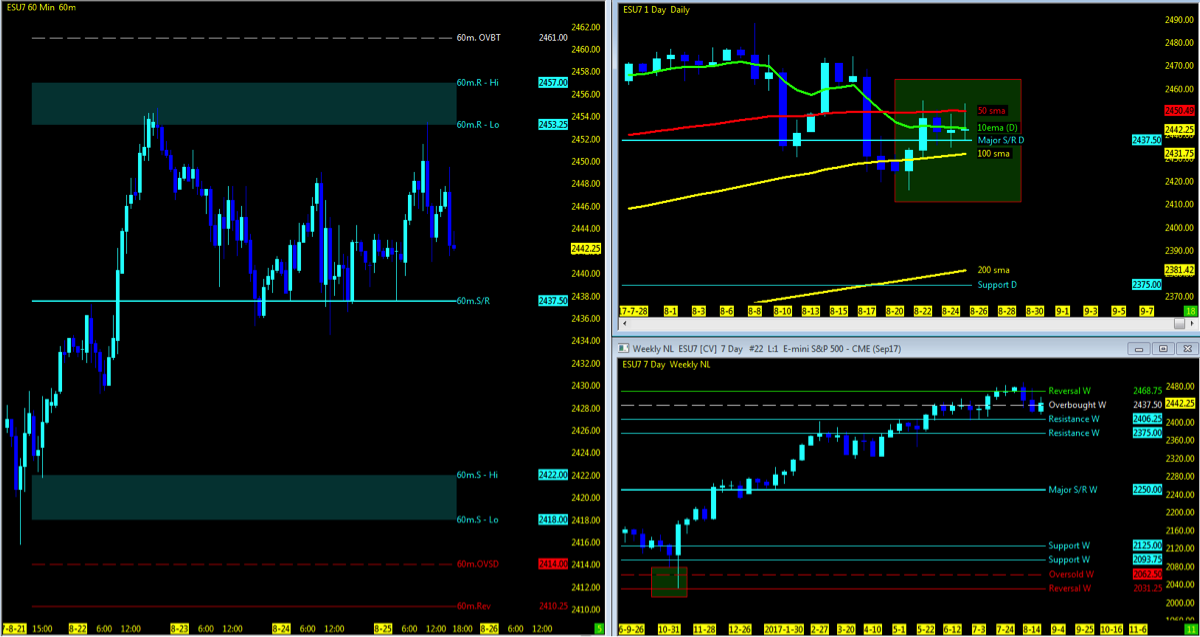
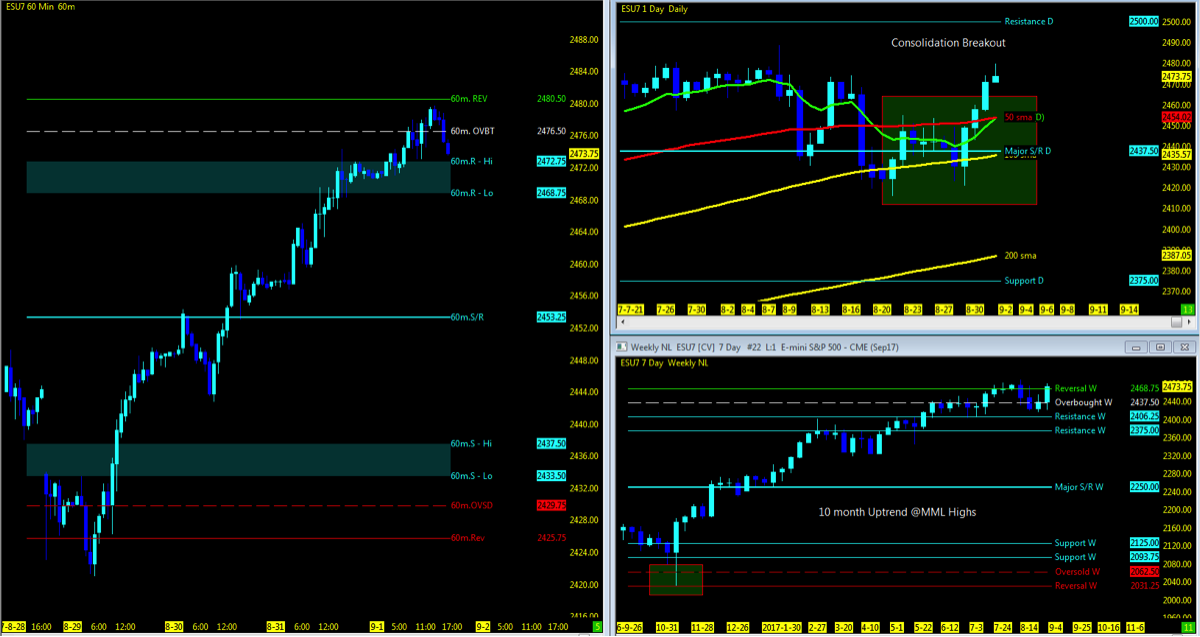
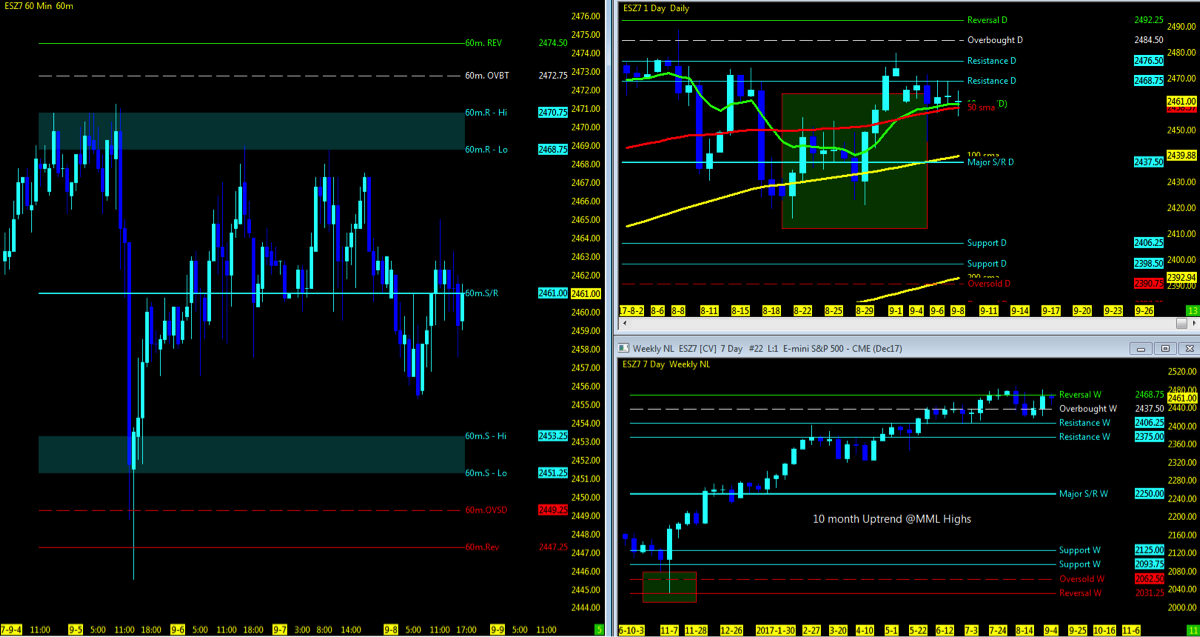
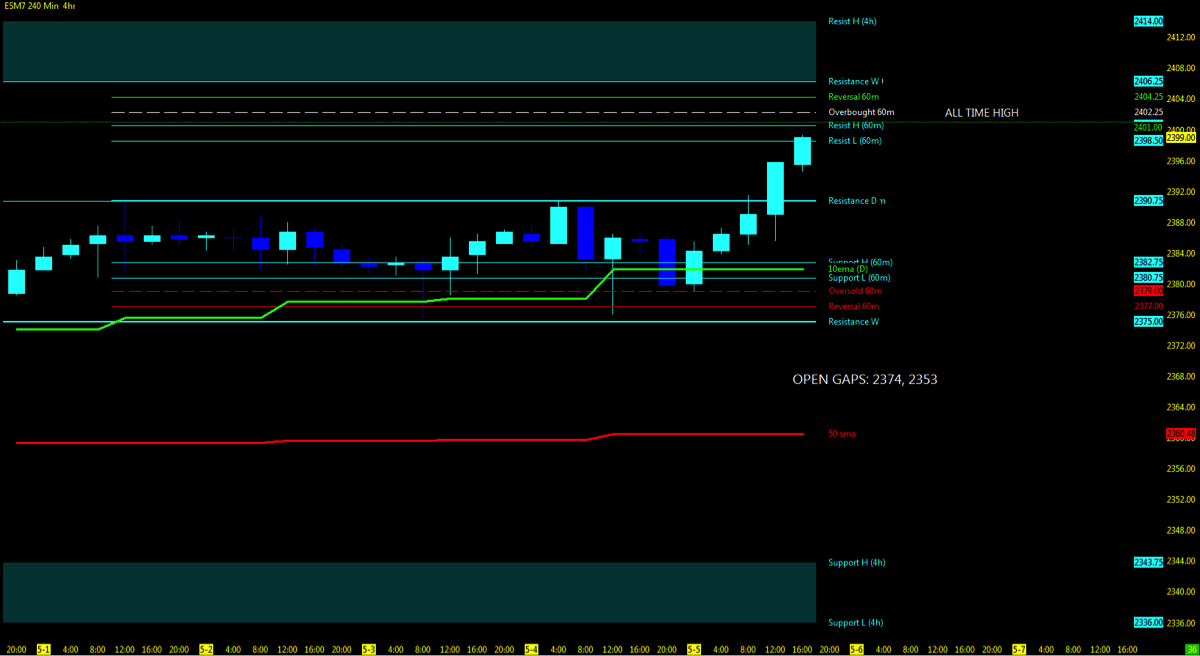
ES – S&P 500 FUTURES
Technical Momentum: UPTREND
Multiple MML Overlay (4hr with 60m/Daily/Weekly)
Nearest Open Daily Gap: 2374, 2353
Lowest Open Gap: 1860.75
Thanks for reading and remember to always use a stop at/around key technical trend levels.
Twitter: @TradingFibz
The author trades futures intraday and may have a position in the mentioned securities at the time of publication. Any opinions expressed herein are solely those of the author, and do not in any way represent the views or opinions of any other person or entity.
The post S&P 500 and Nasdaq Futures Weekly Trend Analysis – May 8 appeared first on See It Market.