Quantcast
Channel: David Katz – See It Market
Viewing all 89 articles
Browse latest View live

Stock Market Futures Weekly Review & Outlook – December 19

$
0
0

The Big Picture – Stock Market Futures

Considering all the hubbub and uncertainty that filled the air in 2016 about the presidential election and Federal Reserve, well both came and went and the market is at all-time highs. Last week traders navigated an expected FOMC announcement of a rate hike and Quad witching options.

Currently, the major stock market indices remain near all time highs despite a small pullback on the FOMC announcement. As volume now rolls into the March contract the ever looming Dow 20,000 and NQ 5,000 may help the market lift a bit higher.

As in any outlook, there is a case to be made for price action in either direction. With countless open gaps below surely at some given time the market will retreat and traders will take profits off the table. That said, relentless markets may also continue higher when at the highs. Consolidation across the stock market indices will lead to our next move. Be ready in both directions.

As always, leave your bias at the door of where you think the market should be. Watch the charts in front of you and stay away from the Z-Vals. Be ready in both directions. The trend reveals itself on Heikin Ashi bars and proper trade management keeps you in the trend.

Attempting to determine which way a market will go on any given day is merely a guess in which some will get it right and some will get it wrong. Being prepared in either direction intraday for the strongest probable trend is by plotting your longer term charts and utilizing an indicator of choice on the lower time frame to identify the setup and remaining in the trade that much longer. Any chart posted here is merely a snapshot of current technical momentum and not indicative of where price may lead forward.


NQ – Nasdaq Futures

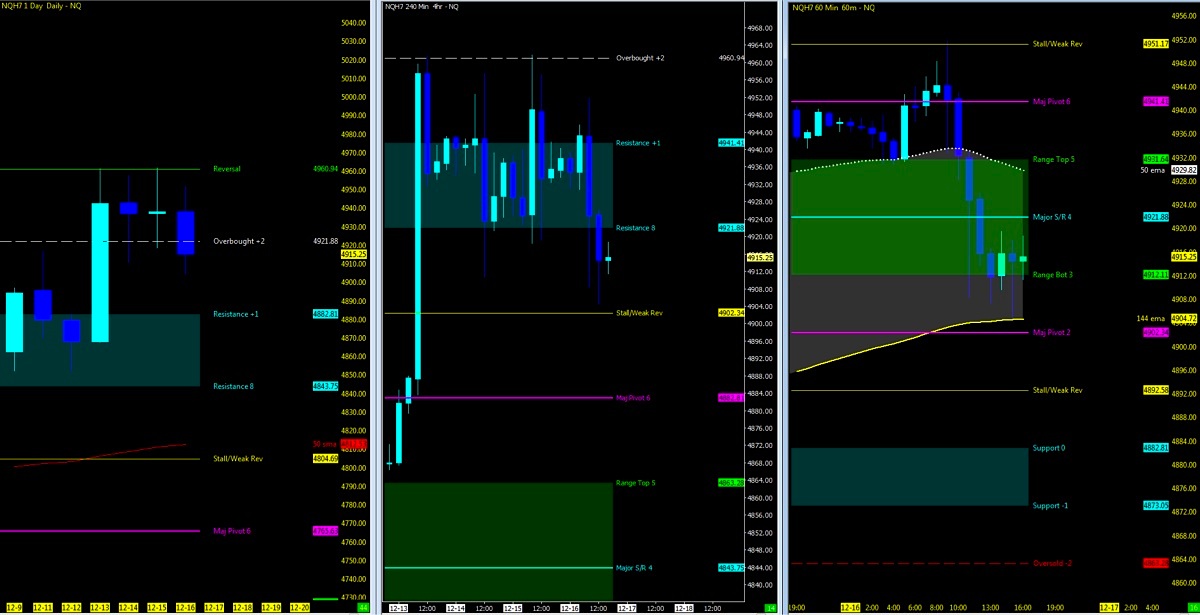
Current Trend: Uptrend Pullback

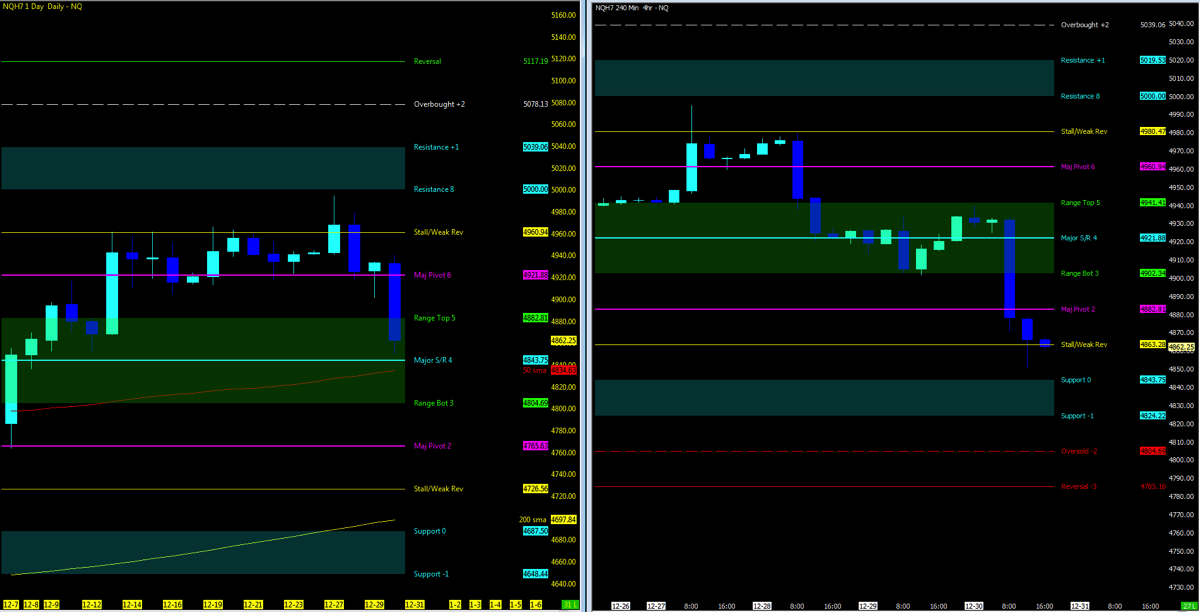
Using the Murray Math Level (MML) charts on higher time frames can be a useful market internal tool as price action moves amongst fractal levels from hourly to daily charts. Confluence of levels may be levels of support/resistance or opportunities for a breakout move.

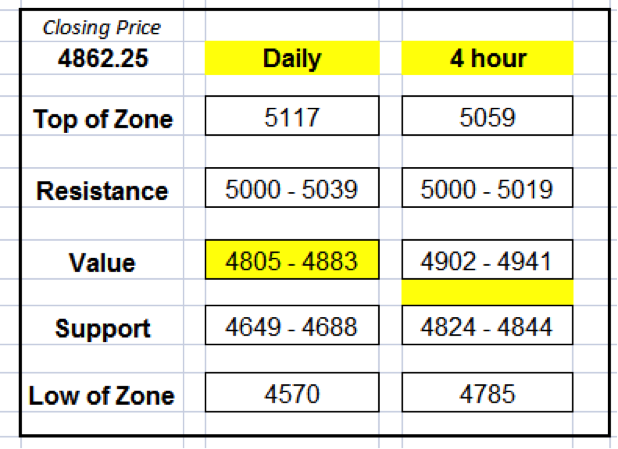
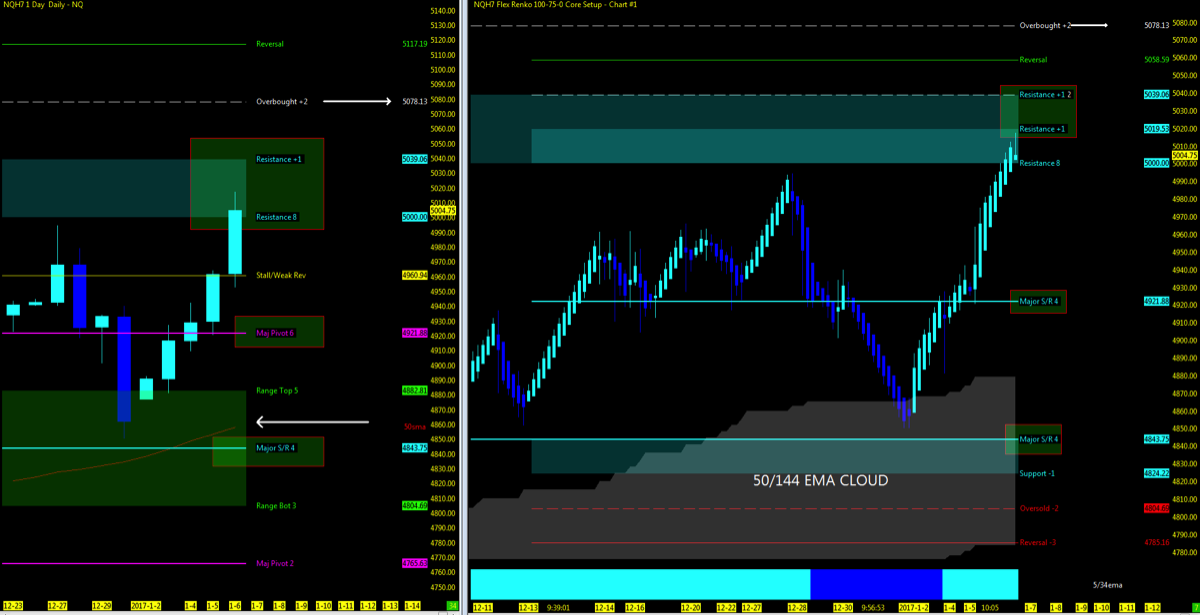
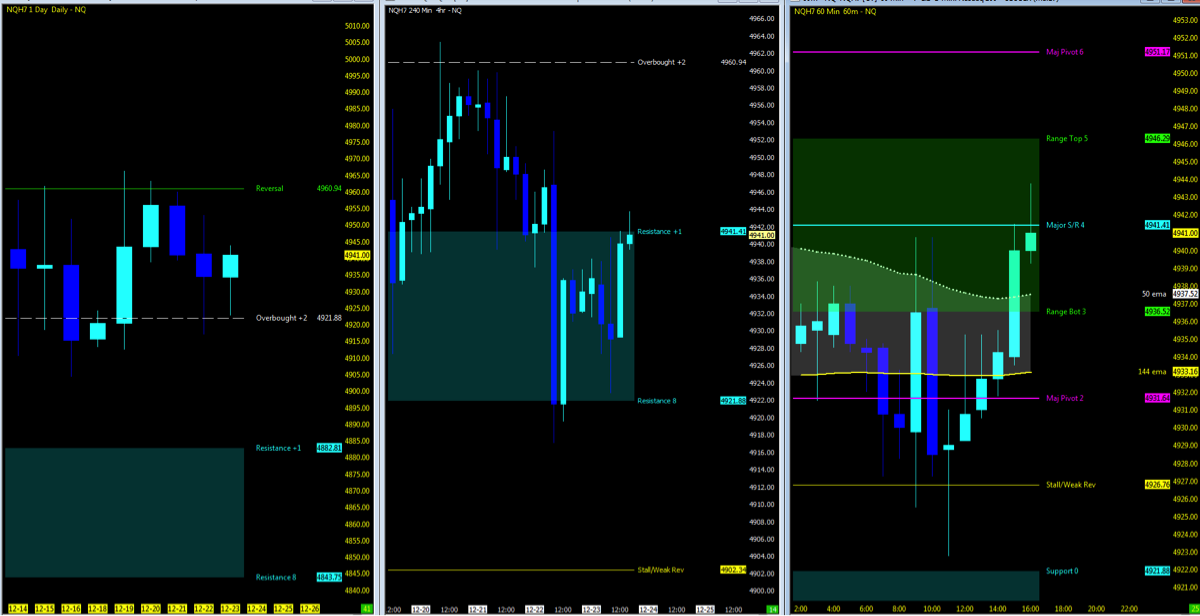
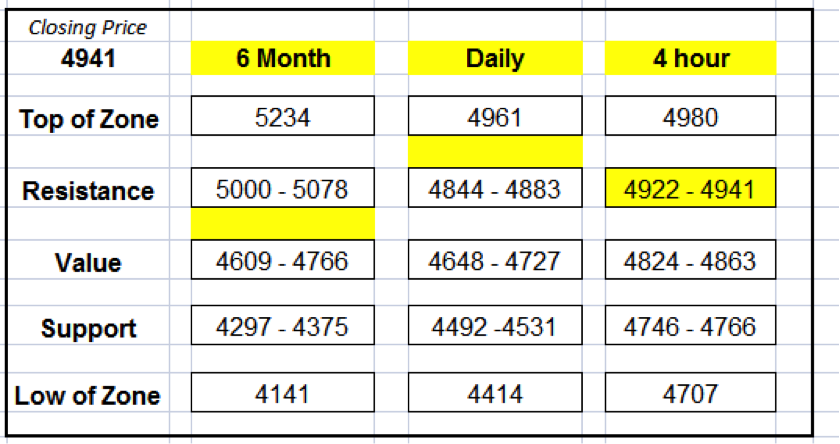
Hourly charts (right) finding support at the 50/144ema cloud and bottom of value on the pullback on Friday. If price action is to break here, look to support downside for a bounce. This would line up with the 4hr Major pivot and top of resistance on the daily. 4863 to the daily 50ma would be the lowest levels at this juncture before the market may find  a buying opportunity. Watch for the breakout above 4941 to a stall at 4960 before heading to 5K.

nasdaq-futures-multiple-trading-time-frames-december-19

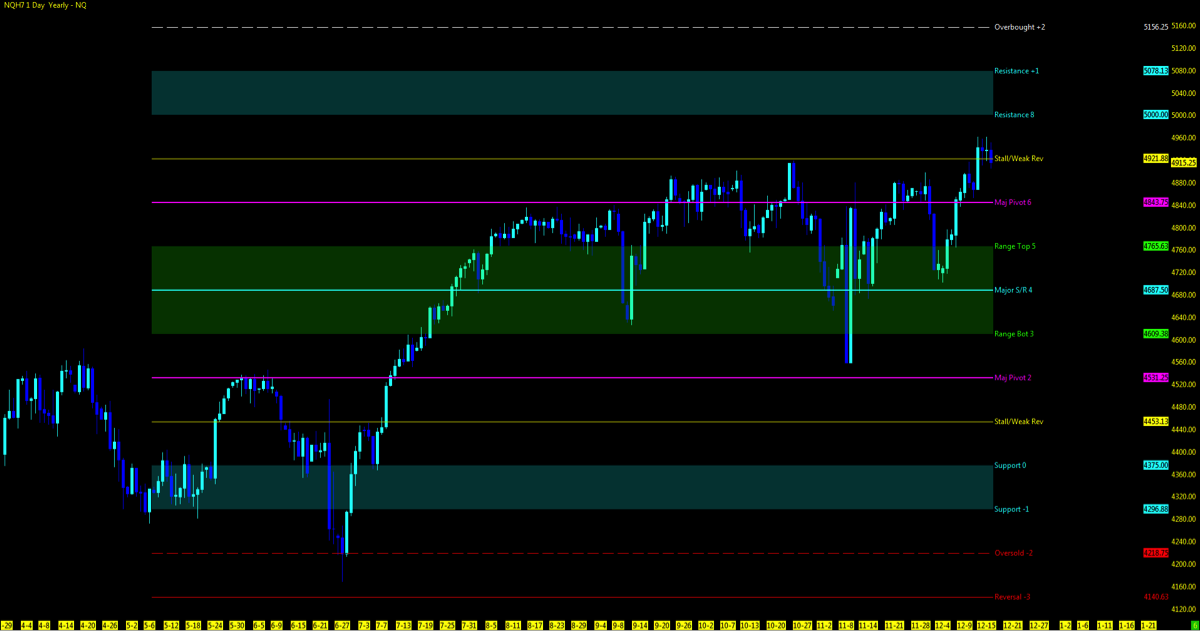
Six month view of the NQ off the lows of June, 2016 seen below reaching to the highs of the year as 5K is just a handle away at the resistance above.

nasdaq-futures-trading-chart-june-2016-to-december-2016

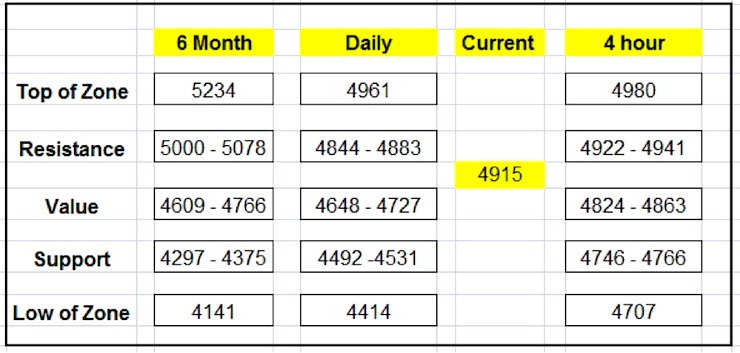
Zones to Watch

nasdaq-futures-trading-zones-to-watch

Nearest Open Daily Gap: 4882.5

Lowest Open Gap: 4017


ES – S&P 500 Futures

Current Trend: Uptrend Pullback

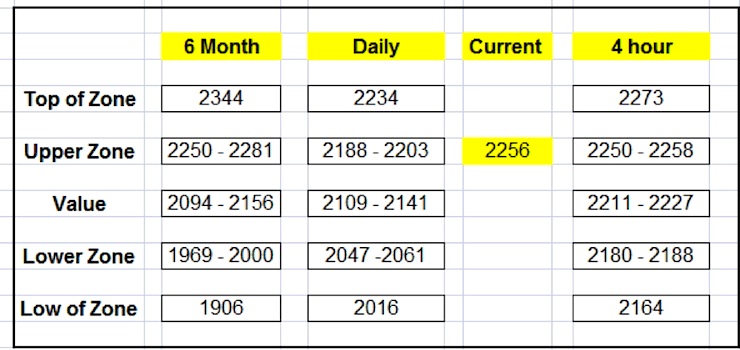
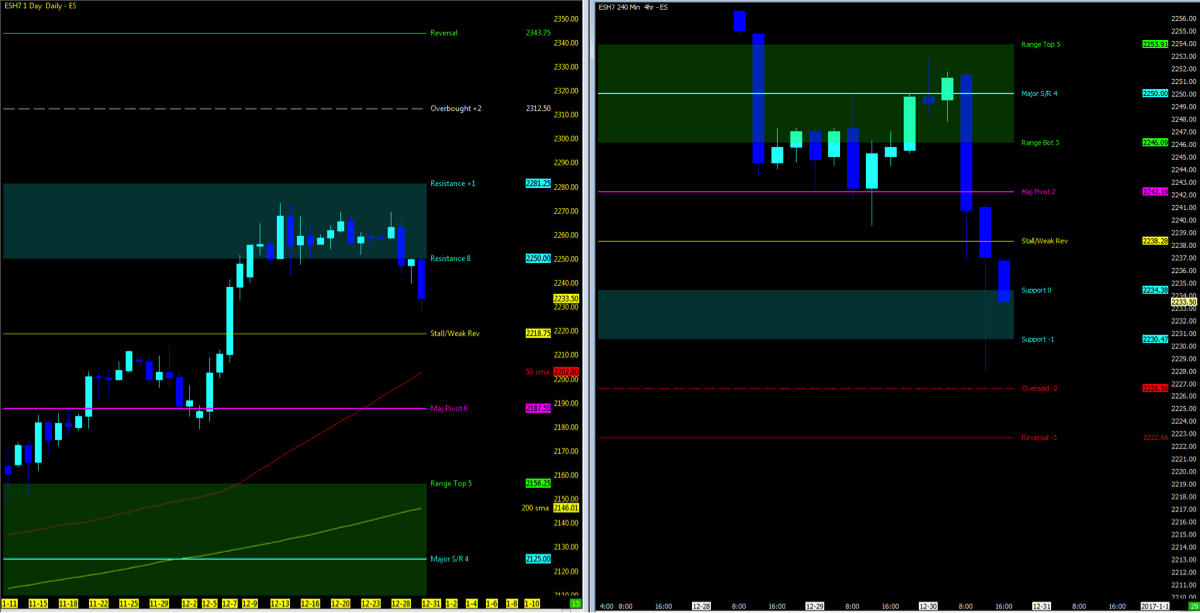
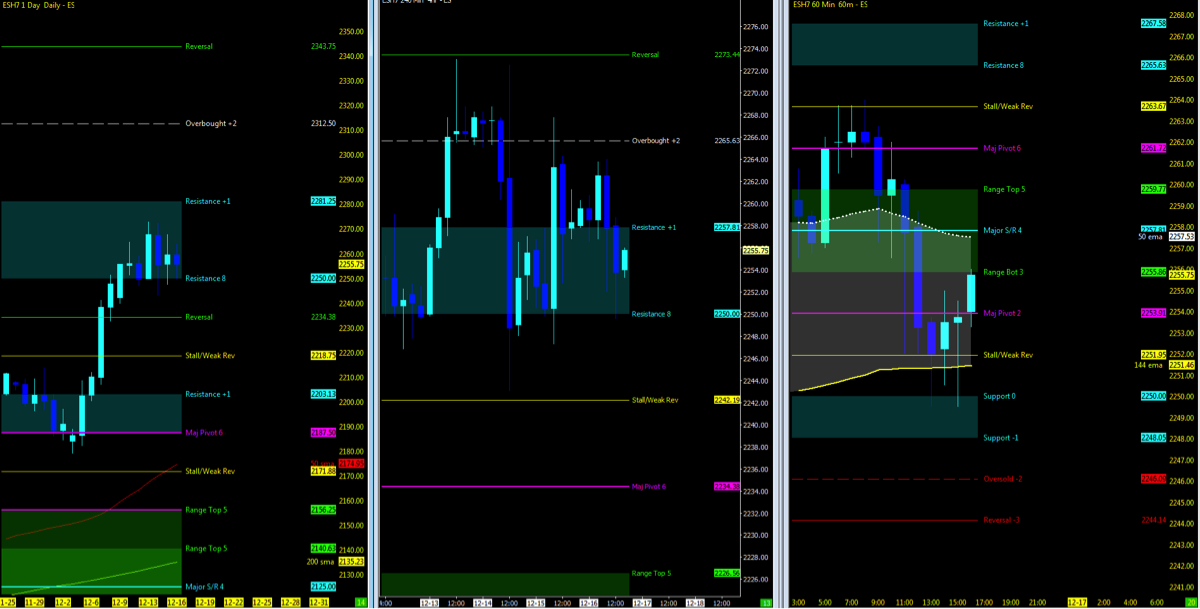
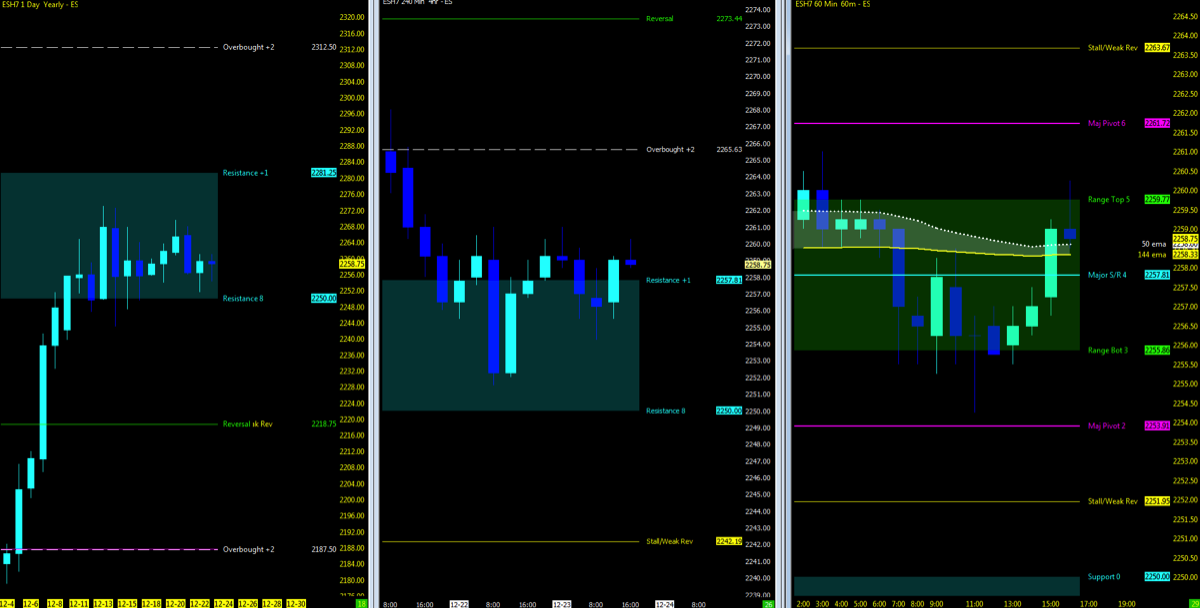
Price action on Friday, finding support off the hourly and 50/144ema may be just what the ES future needs to head upside as the daily upper levels have been breached. Watch the 2265 as the first level of resistance as price heads to 2281 on the 6 month chart below. 2259 is the breakout level to gain momentum to the upside. If unable to hold here and price action breaks down, 2244 is the level to watch. Probability which currently is leading upside, as the hourly 50 is above the 144ema and daily chart holding above the highs. Look to the 6 month chart for the daily long term upper levels if price is to head higher.

s&p 500 futures emini multiple trading time frames december 19

Appreciation on the 6 month chart as the ES off the support levels downside have climbed to resistance and consolidation in week 50.

s&p 500 futures trading chart june 2016 to december 2016

Zones to Watch

s&p 500 futures trading price targets december 19

Nearest Open Daily Gap: 2197.25

Lowest Open Gap: 1860.75


Thanks for reading and remember to always use a stop at/around key technical trend levels.

Don’t forget to view the end-of-the-day charts as momentum in the markets can shift substantially from day to day and reset any charts posted above.


Twitter:  @TradingFibz

The author trades futures intraday and may have a position in the mentioned securities at the time of publication. Any opinions expressed herein are solely those of the author, and do not in any way represent the views or opinions of any other person or entity.


The post Stock Market Futures Weekly Review & Outlook – December 19 appeared first on See It Market.
Stock Market Futures Weekly Review & Outlook – December 26

$
0
0

THE BIG PICTURE – Stock Market Futures

Week 51, you would have never known it was here based on it’s low volume. For some, this is the optimal market as it was rangebound for the better part of the week. I am expecting more of the same as we roll into next week, with market indices not exactly migrating higher but also not breaking through support downside.

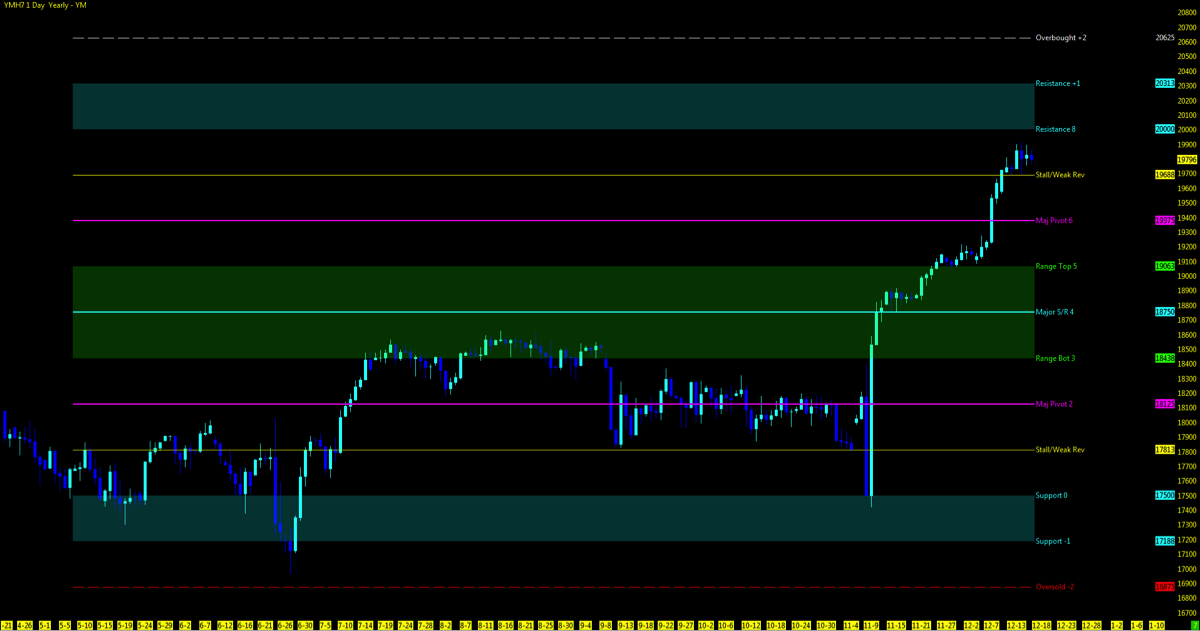
The ever looming all time high on the Dow Jones Industrial Average (INDEXDJX:.DJI) and Futures (YM) holds above for now with it’s day sure to come. Meanwhile, keep your eyes on the hourly levels in combination with your trending strategy of choice. As stated last week, “consolidation in the indices may just be what the market needs at this point for the next move. Being ready in both directions may be your best offense.”  Intraday charts may surely have a setup or two in the first 2.5 hours of the US market open. Otherwise, turn your attention to markets as in the commodities and look for opportunity. There is always the option to just relax and sit out week 52 and see what is outside that cave you bury yourself in all year.

As always, leave your bias at the door of where you think the market should be. Watch the charts in front of you and stay away from the Z-Vals. Be ready in both directions. The trend reveals itself on Heikin Ashi bars and proper trade management keeps you in the trend.

Attempting to determine which way a market will go on any given day is merely a guess in which some will get it right and some will get it wrong. Being prepared in either direction intraday for the strongest probable trend is by plotting your longer term charts and utilizing an indicator of choice on the lower time frame to identify the setup and remaining in the trade that much longer. Any chart posted here is merely a snapshot of current technical momentum and not indicative of where price may lead forward.

You can also view my market outlook video on youtube.

Markets Covered: ES, YM, NQ, CL, GC & 6E


NQ – Nasdaq Futures

Current Trend: Uptrend Pullback

Using the Murray Math Level (MML) charts on higher time frames can be a useful market internal tool as price action moves amongst fractal levels from hourly to daily charts. Confluence of levels may be levels of support/resistance or opportunities for a breakout move.

nasdaq-futures-trading-december-26-2016

Zones to Watch

nasdaq-futures-emini-nq-price-targets-december-26

Nearest Open Daily Gap: 4882.5

Lowest Open Gap: 4017


ES – S&P Futures

Current Trend: Uptrend Pullback

sp-500-futures-emini-trading-chart-trend-december-26

Zones to Watch

sp-500-es-mini-trading-price-targets-week-december-26

Nearest Open Daily Gap: 2197.25

Lowest Open Gap: 1860.75


YM – DOW Futures

Current Trend: Uptrend Pullback

dow-jones-emini-ym-futures-trading-trend-chart-december-26

Zones to Watch

dow-jones-industrial-price-targets-week-december-26

Nearest Open Daily Gap: 18929

Lowest Open Gap: 15924


Thanks for reading and remember to always use a stop at/around key technical trend levels.

Twitter:  @TradingFibz

The author trades futures intraday and may have a position in the mentioned securities at the time of publication. Any opinions expressed herein are solely those of the author, and do not in any way represent the views or opinions of any other person or entity.


The post Stock Market Futures Weekly Review & Outlook – December 26 appeared first on See It Market.

Stock Market Futures Weekly Review & Outlook – January 1

$
0
0

THE BIG PICTURE – Stock Market Futures

2016 is out the door.  Welcome to 2017!

You may have never thought we would make it through the presidential election in one piece and the uncertainty from one fed meeting to another didn’t make anything feel very smooth. However, markets eventually consolidated gains and losses and are doing so with the post-election run up right now.

Heading into 2017, we are faced with similar uncertainty. Questions around how many fed rate hikes will we see, how will Brexit play out, Trumpenomics and the unsettling world civility seem to be at the forefront of our attention.

That said, as traders we simply take one day and one week at a time. Currently, it seems reasonable to expect a pullback to downside open gaps. Will that occur before or after Dow 20k? Volume should return as traders emerge from their holiday caves and once again bring some daily momentum to the charts.

My best memory of 2016? The Cubs winning the World Series.

As always, leave your bias at the door of where you think the market should be. Watch the charts in front of you and stay away from the Z-Vals. Be ready in both directions. The trend reveals itself on Heikin Ashi bars and proper trade management keeps you in the trend.

Attempting to determine which way a market will go on any given day is merely a guess in which some will get it right and some will get it wrong. Being prepared in either direction intraday for the strongest probable trend is by plotting your longer term charts and utilizing an indicator of choice on the lower time frame to identify the setup and remaining in the trade that much longer. Any chart posted here is merely a snapshot of current technical momentum and not indicative of where price may lead forward.

Note that you can also view my market outlook for ES, YM, and NQ on YouTube.


Nasdaq Futures – NQ

Using the Murray Math Level (MML) charts on higher time frames can be a useful market internal tool as price action moves amongst fractal levels from hourly to daily charts. Confluence of levels may be levels of support/resistance or opportunities for a breakout move.

nasdaq-100-nq-futures-trading-trends-chart-january-1-2017

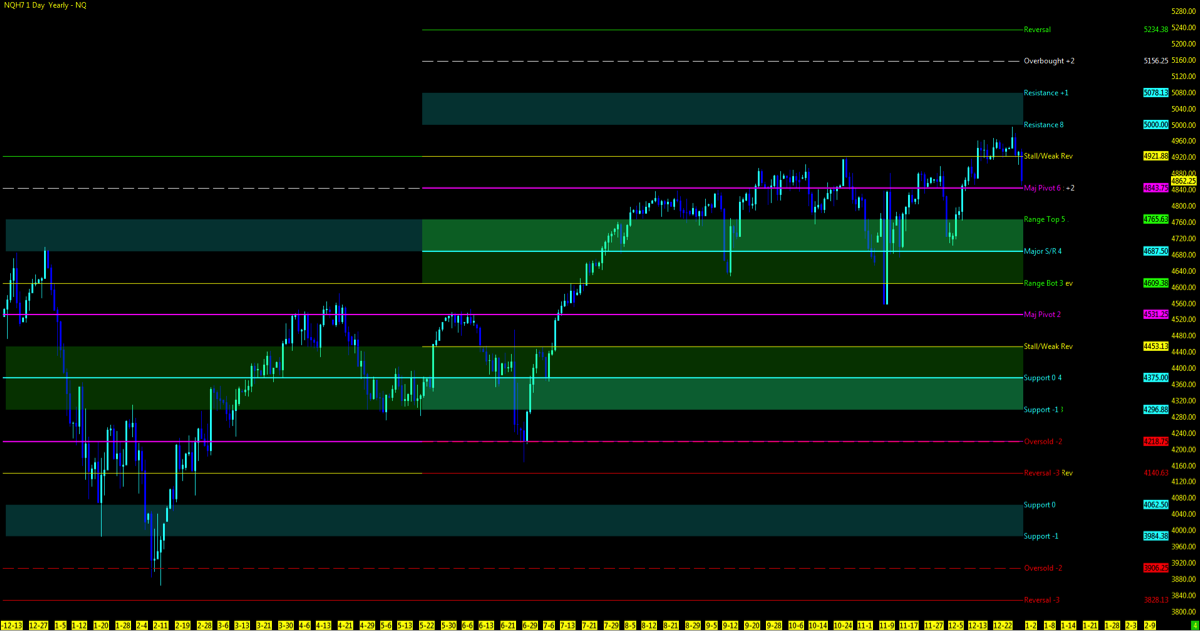
Yearly Picture

nasdaq-futures-chart-year-2016-trading-trend

MML Levels (NQ)

nasdaq-futures-trading-levels-price-targets-january-1

Nearest Open Daily Gap: 4610.75

Lowest Open Gap: 4017


S&P Futures – ES

s&p 500 futures emini trading trends chart january 1


          continue reading on the next page…

The post Stock Market Futures Weekly Review & Outlook – January 1 appeared first on See It Market.

Stock Market Futures Weekly Review & Outlook: January 9

$
0
0

THE BIG PICTURE – Stock Market Futures

2017 rolled in with a dud as the stock market indices ended the year on a low note. And although early trading started off strong, it took a couple days to get a read on the trend.

The jobs report was the latest catalyst to push stocks higher… high enough for the DOW to miss 20k by 0.37 ticks but good enough for the NQ futures to ring the 5K bell.  So, now what?

As with any time in the past when the stock market indices continue to push to new highs, there will be two opinions on the market. Those that side with “when at the highs, we go higher” and those that persistently are pessimistic and think the market should just crash. But it’s best to have a process and follow it.

In the week to come I expect the Dow Jones futures to ring the 20K bell. But beware of some volatility – volume has returned to the market and multiple fed speakers are on tap this week. Watch for Yellen’s speech on Thursday night.

Although probability points to higher prices in the days ahead, any news catalyst can also throw this market in the opposite direction. On a move lower, we need to watch the daily 50ma or major support on the MML (Murray Math) charts. Always be ready for both directions intraday.

As always, leave your bias at the door of where you think the market should be. Watch the charts in front of you and stay away from the Z-Vals. Be ready in both directions. The trend reveals itself on Heikin Ashi bars and proper trade management keeps you in the trend.

Attempting to determine which way a market will go on any given day is merely a guess in which some will get it right and some will get it wrong. Being prepared in either direction intraday for the strongest probable trend is by plotting your longer term charts and utilizing an indicator of choice on the lower time frame to identify the setup and remaining in the trade that much longer. Any chart posted here is merely a snapshot of current technical momentum and not indicative of where price may lead forward.

Note that you can also view my market outlook for ES, YM, and NQ on YouTube.


Nasdaq Futures – NQ

Hourly Chart: UPTREND

Using the Murray Math Level (MML) charts on higher time frames can be a useful market internal tool as price action moves amongst fractal levels from hourly to daily charts. Confluence of levels may be levels of support/resistance or opportunities for a breakout move.

Daily Range Chart

nasdaq-futures-stock-market-futures-chart-trend-analysis-january-9-2017

Levels to Watch

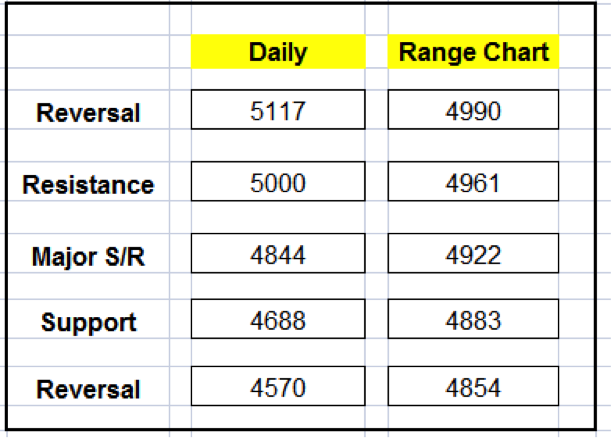
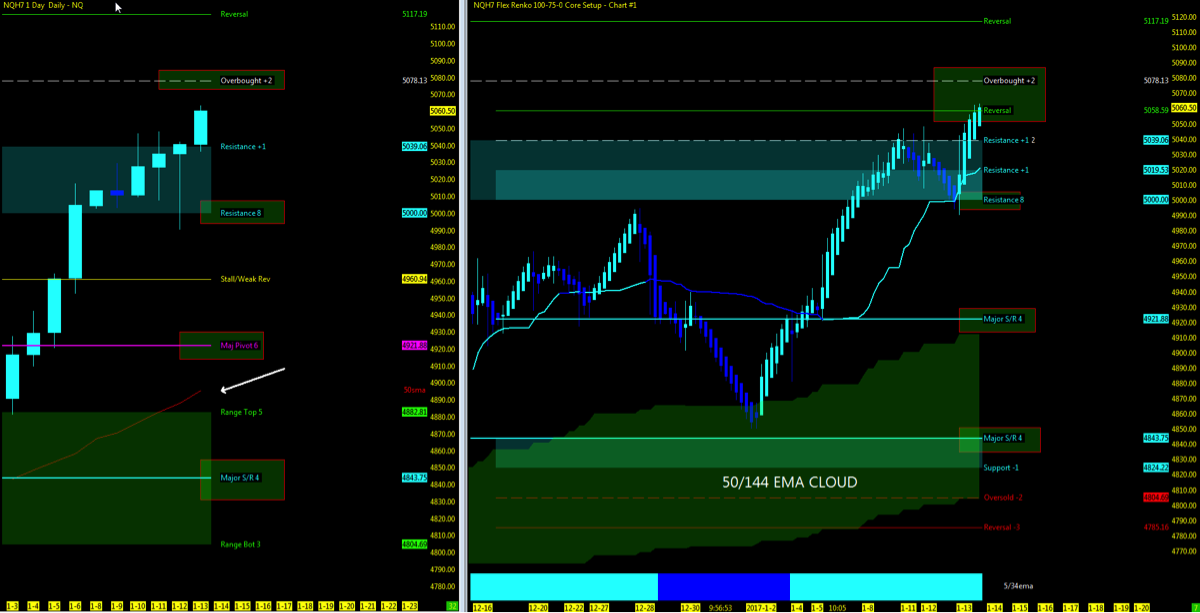
  • Upside: 5078 if we break 5039
  • Downside: 4922 (50ma below)
  • Major S/R: 4843 (50ma in zone) if we break 4882

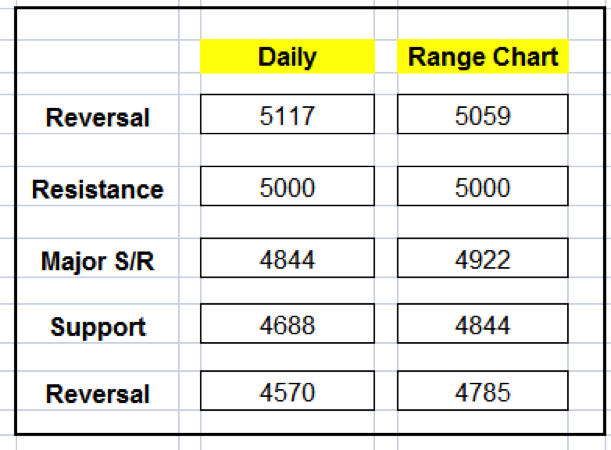
MML Levels (NQ)

nasdaq-futures-chart-price-targets-january-9-2017

Nearest Open Daily Gap: 4610.75

Lowest Open Gap: 4017


S&P Futures – ES

Hourly Chart: UPTREND

s&p 500 trading trend chart analysis january 9 2017

Levels to Watch

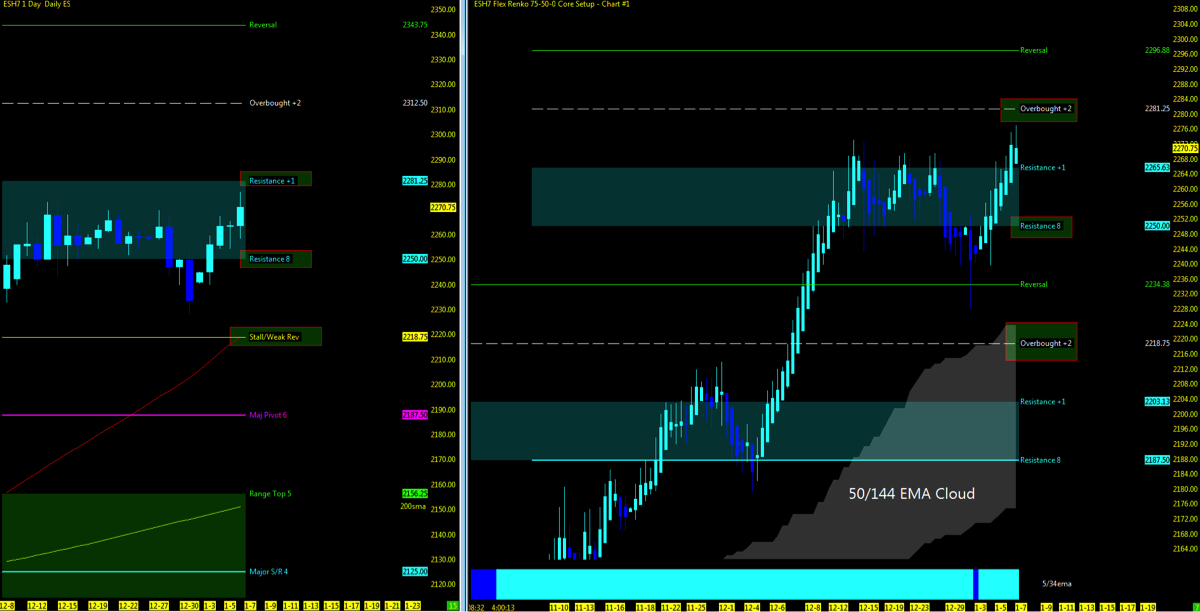
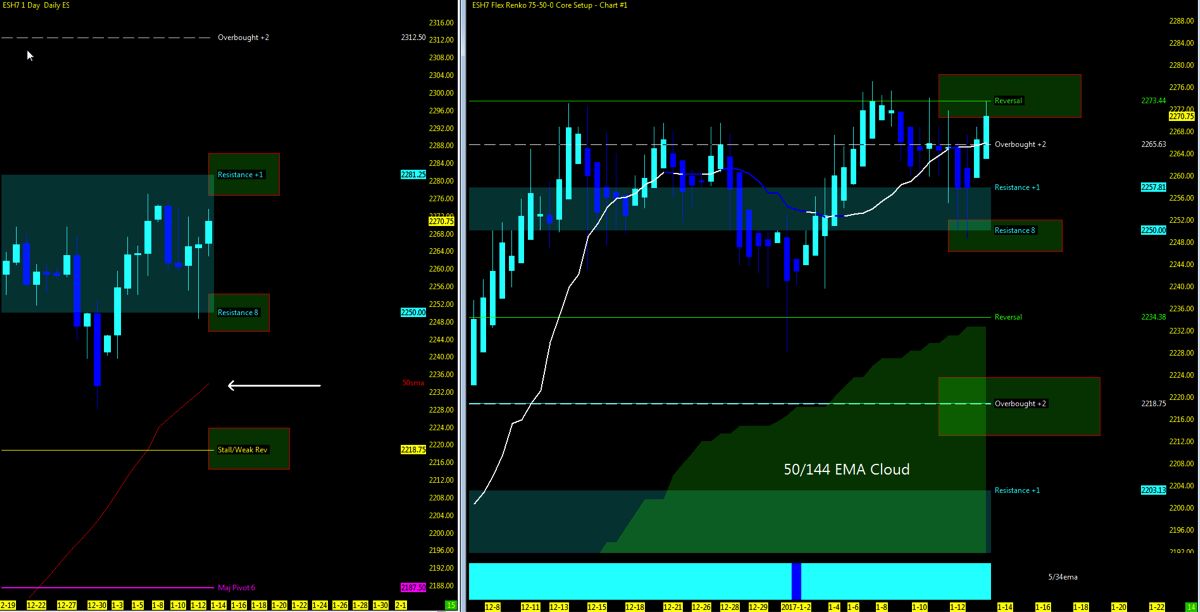
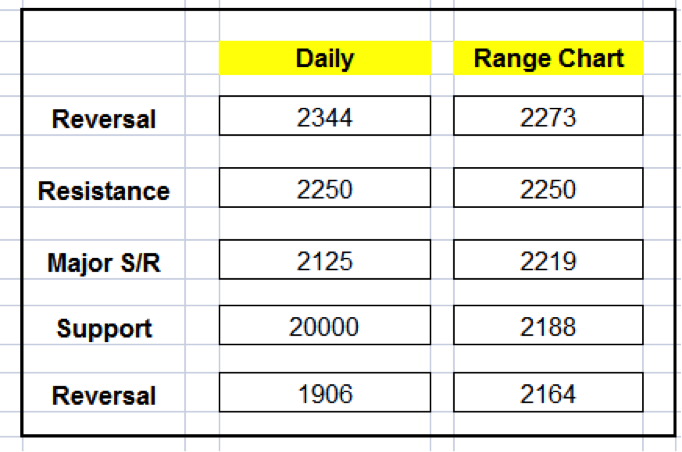
  • Upside: 2312 (watch 2218.25 resisatance)
  • Downside: 2218.75 (50ma in zone) if we break 2250
  • Major S/R: 2125 (200ma above)

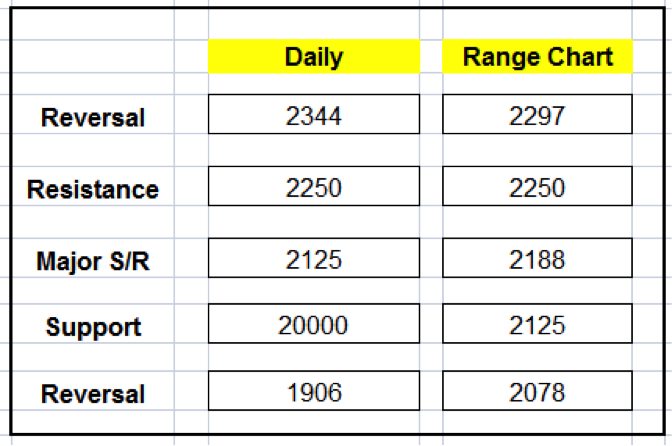
MML Levels (ES)

s&p 500 futures es chart price targets january 9 2017

Nearest Open Daily Gap: 2197.25

Lowest Open Gap: 1860.75


Thanks for reading and remember to always use a stop at/around key technical trend levels.

Twitter:  @TradingFibz

The author trades futures intraday and may have a position in the mentioned securities at the time of publication. Any opinions expressed herein are solely those of the author, and do not in any way represent the views or opinions of any other person or entity.


The post Stock Market Futures Weekly Review & Outlook: January 9 appeared first on See It Market.

Stock Market Futures Weekly Review & Outlook – January 16

$
0
0

THE BIG PICTURE

Consolidation on Dow Jones futures (YM) and S&P 500 futures (ES) seems to be the trend of 2017 as Nasdaq futures (NQ) steams ahead and leaves the indices in its dust trail. Week two, day four (1.12.17) seemed to be the hope of some correction in the market, only to quickly recover intraday. Seems to be the common thread of the market these days. It was my hope in week two the YM would retest the 20K, ring the bell and whatever came next leave it to the big crumbs. Note I said “hope,” not will.

So what appears to be evident at this point and what may the market be waiting for?  Is the S&P 500 (INDEXSP:.INX) ready for new highs? Will the Nasdaq (INDEXNASDAQ:.IXIC) keep making higher highs?  Let’s explore.

Fact #1 is that on the post pre-POTUS win for Trump, markets rallied higher. We continue to hold at those highs. The factoid that whatever pullback is occurring is only being bought back up continuing the momentum upside. This is lending to the appearance that this market is just not ready or in a position for any significant pullback. However we all know it doesn’t take much for a market to turn at any given moment. A tweet by Trump, a word out of Yellen that will turn the ALGO machines on overdrive.

With multiple fed speakers in the week ahead, including Yellen, POTUS inauguration with subsequent first days of office and FANG stocks earnings season upon us may be the catalyst we need to push in either direction.

As previously stated, in any time in the past when indices to continue to push at the highs, there will be an evident of two sides in the market. Those that side with “when at the highs we go higher” and those that persistently are pessimistic and think the market should just crash. While I seek the short side as well, any good pullback is always signs of a healthy market, at some point, prices recover and make higher highs.

Technical momentum probability at this point leads us higher on the bigger pic in my humble opinion if all things remain constant and nothing occurs to shake things up downside. Then again you can tune in to the perma-bears and miss the continued run up in the market and sit out the gains since election results and when the market does correct itself, “they” will tell you they told you so. Meanwhile you missed out because you let your bias in the way of where the markets should be and where it actually is.

Note that you can also view my market outlook for ES, YM, and NQ on YouTube.


Attempting to determine which way a market will go on any given day is merely a guess in which some will get it right and some will get it wrong. Being prepared in either direction intraday for the strongest probable trend is by plotting your longer term charts and utilizing an indicator of choice on the lower time frame to identify the setup and remaining in the trade that much longer. Any chart posted here is merely a snapshot of current technical momentum and not indicative of where price may lead forward.


NQ – Nasdaq Futures

Technical Momentum: UPTREND

Using the Murray Math Level (MML) charts on higher time frames can be a useful market internal tool as price action moves amongst fractal levels from hourly to daily charts. Confluence of levels may be levels of support/resistance or opportunities for a breakout move.

nasdaq-futures-trading-trends-chart-analysis-january-16-2017

Levels to Watch

  • Upside: 5078 if we hold above 5039
  • Downside: 5000 (50ma below)
  • Major S/R: 4844 (50ma above)

MML Levels (NQ)

nasdaq-futures-trading-price-targets-week-of-january-17

Nearest Open Daily Gap: 4610.75

Lowest Open Gap: 4017

ES – S&P Futures

Technical Momentum: UPTREND

s&p 500 futures trading trends chart analysis january 16 2017

Levels to Watch

  • Upside: 2281 (watch 2273 resistance)
  • Downside: 2250 (50ma below) if we break 2250
  • Major S/R: 2125 (200ma above)

MML Levels (ES)

s&p 500 futures trading price targets week january 16

Nearest Open Daily Gap: 2197.25

Lowest Open Gap: 1860.75


Thanks for reading and remember to always use a stop at/around key technical trend levels.

Twitter:  @TradingFibz

The author trades futures intraday and may have a position in the mentioned securities at the time of publication. Any opinions expressed herein are solely those of the author, and do not in any way represent the views or opinions of any other person or entity.


The post Stock Market Futures Weekly Review & Outlook – January 16 appeared first on See It Market.

Stock Market Futures Weekly Outlook – January 23

$
0
0

THE BIG PICTURE

2017, not exactly off to a great start.

Indices continue to consolidate at the highs as the market refuses to run away in either direction. That said, there’s micro-pockets of opportunity on any given day, so (frustration aside) patience is the key here.

Could it be that the market may just be waiting for “Trumpenomics” to lay the ground for where we may be headed next? At some point, markets will either recoil and pullback or head higher… and traders should be ready for either direction.

Over the first four weeks of 2017, I have laid the foundation for where and what may be the catalyst. At this point, and by the charts alone, my technical indicators will be the guide as to where the highest probability trend may be.

Whether it’s Fibonacci or Murray Math levels (MML) or for that matter, any fractal line, the market is surely to test either side. To the downside, the 50 period moving averages closing in as the MML resistance levels hold. Technical momentum probability still remains at this point to lead us higher on the bigger pic (in my humble opinion). But that can change fast.

You may continue to tune in to the “perma-bears” and miss any continued run up in the market while awaiting a correction to the downside. By now, there is no harm in holding here as we slide sideways and await a new trend. But traders need to tune out the bias to succeed.

Watch for MSFT, GOOG , SBUX earnings this week along with GDP to wrap up the week. The VIX strike prices of 21/22 for Feb 15 is something to take into consideration as well.


Note that you can also view my market outlook for ES, YM, and NQ on YouTube.

Attempting to determine which way a market will go on any given day is merely a guess in which some will get it right and some will get it wrong. Being prepared in either direction intraday for the strongest probable trend is by plotting your longer term charts and utilizing an indicator of choice on the lower time frame to identify the setup and remaining in the trade that much longer. Any chart posted here is merely a snapshot of current technical momentum and not indicative of where price may lead forward.


NQ – Nasdaq Futures

Technical Momentum: UPTREND

Using the Murray Math Level (MML) charts on higher time frames can be a useful market internal tool as price action moves amongst fractal levels from hourly to daily charts. Confluence of levels may be levels of support/resistance or opportunities for a breakout move.

  • Top Row: Weekly, Daily; 4hour
  • Bottom row: 60m, 15m        

nasdaq-futures-trading-trends-chart-january-23-2017

Levels to Watch

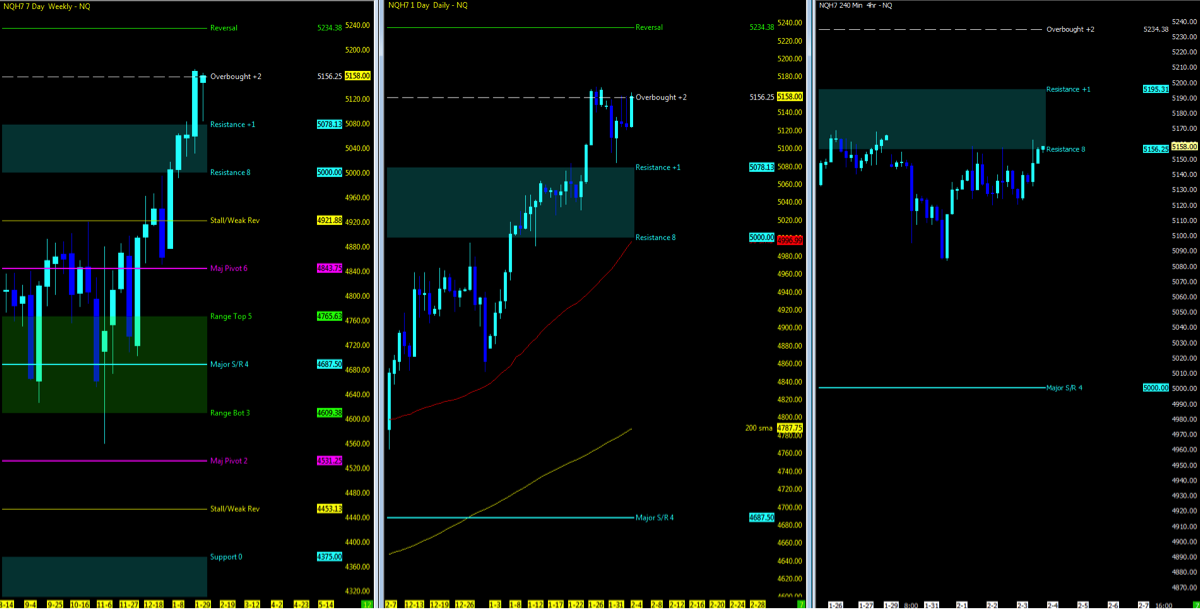
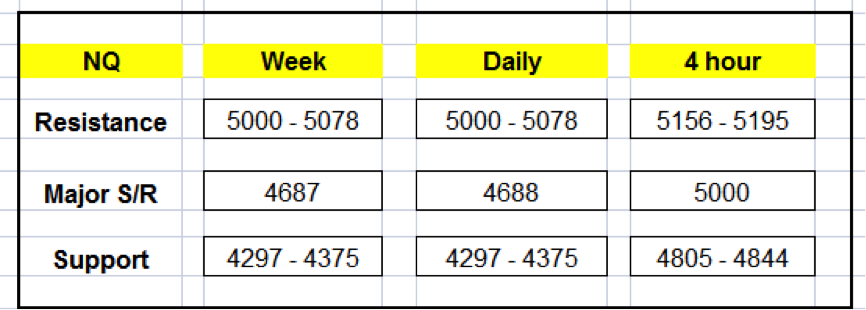
  • Upside: 5156 if we hold above 5078
  • Downside: 5000 (50ma below)
  • Major S/R: 4844 (50ma above)

MML Levels (NQ)

nasdaq-futures-price-targets-trading-week-january-23-2017

Nearest Open Daily Gap: 4610.75

Lowest Open Gap: 4017


ES – S&P Futures

Technical Momentum: UPTREND

s&p 500 futures trading trends chart january 23 2017

Levels to Watch

  • Upside: 2281 (watch 2273 resistance)
  • Downside: 2250 (50ma below)
  • Major S/R: 2125 (200ma above)

MML Levels (ES)

s&p 500 futures price targets trading week january 23 2017

Nearest Open Daily Gap: 2197.25

Lowest Open Gap: 1860.75


YM – DOW Futures

Technical Momentum: UPTREND

dow-jones-futures-trading-trends-chart-january-23-2017

Levels to Watch

  • Upside: 20000
  • Downside: 19688 (50ma below)
  • Major S/R: 18750

MML Levels (YM)

dow-jones-futures-price-targets-trading-week-january-23-2017

Nearest Open Daily Gap: 18929

Lowest Open Gap: 15924


Thanks for reading and remember to always use a stop at/around key technical trend levels.


Twitter:  @TradingFibz

The author trades futures intraday and may have a position in the mentioned securities at the time of publication. Any opinions expressed herein are solely those of the author, and do not in any way represent the views or opinions of any other person or entity.


The post Stock Market Futures Weekly Outlook – January 23 appeared first on See It Market.

Stock Market Futures Weekly Outlook – January 29

$
0
0

THE BIG PICTURE 

Ok everyone…just breathe.

Between daily White House press conferences and earnings season, traders seem to have their hands full. However, between each and every one of these moments, I really cannot say that much is going on in the price action.

I can’t remember the last time I have watched a range bar not move for almost two hours. If you enjoy watching paint dry or grass grow, we are in your kind of market. That said, pretty much every day offers up some sort of micro trend for day traders like myself… but it still has us asking “where is this market headed next? And it’s hard with all the permabears consistently pointing to the sky is falling.

So what precaution can we take on the long term while still looking for opportunities to trade this week?

First, let’s expect continued news and sound bites from Washington that may send mini-ripples throughout the market on any given day. Next up, part two of our F.A.N.G. stocks may be a catalyst for the Nasdaq (INDEXNASDAQ:.IXIC). Last week’s earnings gave the Nasdaq futures (NQ) enough stamina to remain at the highs. We also close out the month with the FOMC announcement and money managers balancing their mega portfolios.

Now that the Dow Jones Industrials hit 20K (and S&P 500 hit 2300) and markets seem to be content at these levels without any sign of a serious pullback (yet), my concern is over the buildup of bearish sentiment in the market and permabear influence. All it will take is one “not so good” news bit and the cascade is initiated (keep an eye on the WH admin travel ban and China military provocations). Permabears will then inform you that they told you so. Until then, daily observations of the intraday trend are relentless in picking up off the lows and bringing back into value. Technical signs for me of a market not ready to let the “bears” out to play.

As a crumb trader you are at the whim of using your intraday technical charts to leave emotion aside and be ready for the market to move in either direction. Precautions may include moving stops up and watching internals as in the ADX or the MML levels on multiple time frames. So is this the opportune time to short the market indices?

Technical momentum probability still points to higher but “with caution” on the bigger picture (in my humble opinion). I state with caution as seen in the charts below we are at a technical momentum decision time based on my strategy that puts price action in a stall at the highs.


Note that you can also view my market outlook for ES, YM, and NQ on YouTube.

Attempting to determine which way a market will go on any given day is merely a guess in which some will get it right and some will get it wrong. Being prepared in either direction intraday for the strongest probable trend is by plotting your longer term charts and utilizing an indicator of choice on the lower time frame to identify the setup and remaining in the trade that much longer. Any chart posted here is merely a snapshot of current technical momentum and not indicative of where price may lead forward.


NQ – Nasdaq Futures

Technical Momentum: UPTREND

Using the Murray Math Level (MML) charts on higher time frames can be a useful market internal tool as price action moves amongst fractal levels from hourly to daily charts. Confluence of levels may be levels of support/resistance or opportunities for a breakout move.

CHARTS: Weekly, Daily; 4hour


MML Levels (NQ)

Nearest Open Daily Gap: 5104

Lowest Open Gap: 4017


ES – S&P Futures

Technical Momentum: UPTREND

CHARTS: Weekly, Daily; 4hour

s&p 500 futures trading chart es trend analysis january 29


MML Levels (ES)

s&p 500 futures trading price targets january 29

Nearest Open Daily Gap: 2280.5

Lowest Open Gap: 1860.75


Thanks for reading and remember to always use a stop at/around key technical trend levels.

Twitter:  @TradingFibz

The author trades futures intraday and may have a position in the mentioned securities at the time of publication. Any opinions expressed herein are solely those of the author, and do not in any way represent the views or opinions of any other person or entity.


The post Stock Market Futures Weekly Outlook – January 29 appeared first on See It Market.

Stock Market Futures Weekly Outlook: February 6

$
0
0

THE BIG PICTURE 

Did you remember to breathe last week as I instructed?  (insert smiley face)

Without a doubt it took a lot of patience in week five of 2017, as a vast amount of data & news was tossed around the marketplace. Unless you learn to be patient, disciplined and follow your trading plan, the volatility alone can chew you up and spit you out.

Remaining calm and collected allows the market to serve you pockets of trend (opportunities). I know, it can be very frustrating entering into a day session after a good overnight run, only to chop and eventually pullback.

If you are a follower of my blog, articles and/or daily charts, you are aware of what a high probability setup appears like when price is in momentum. You may also be privy to what it takes to ride a momentum wave once in it. The key for every setup is patience and discipline. Hoping is not a technical indicator so a solid trading plan includes trade management and an awareness to act in either direction.

Being ready for both directions seems to be the ever growing sentiment in the INDICES as an increasing amount of investors in the VIX etf’s pile in and pessimism continues to build as stated by a most recent data poll by AAII.  With market euphoria continuing to hold at new highs and earnings that appear to be doing well, it is no wonder that the interest has peaked. For the intraday trader, you may wonder on any given day if there are any traders left in the market as volume seems to come to a dead stall for hours. Rest assured, they are there.

Looking ahead to week 6:  On the economic front, we ease back from last week and market is able to digest the recent data and new earnings coming out. Surely the push up on Friday of the non-farm payrolls was the catalyst the market needed to regain the upper levels. Technically on the charts, we are at a pause from previous highs and without any defining news moment out of Washington or the world at hand, we have room to move up. To the downside, I’ll continue to monitor the VIX open interest strike prices of 21-23 for Feb15 which may lead the market for a pullback in the next two weeks to key lower MMl levels and open gaps. I’ll be watching those first 2.5 hours of the US session, and will use the PM session to manage any prior entries.

Bottom Line

Technical momentum probability CONTINUES to remain at this point to lead us a bit higher on the indices “with caution” on the bigger pic in my humble opinion if all things remain constant and nothing occurs to shake things up downside as stated over the last several weeks. At this point it won’t take much! I state with caution as seen in the charts below we are at a technical momentum decision time as we were last week based on my strategy that puts price action in a stall at these levels.

Note that you can also view my market outlook for ES, YM, and NQ on YouTube.

Attempting to determine which way a market will go on any given day is merely a guess in which some will get it right and some will get it wrong. Being prepared in either direction intraday for the strongest probable trend is by plotting your longer term charts and utilizing an indicator of choice on the lower time frame to identify the setup and remaining in the trade that much longer. Any chart posted here is merely a snapshot of current technical momentum and not indicative of where price may lead forward.


Nasdaq Futures (NQ)

Technical Momentum: UPTREND

Using the Murray Math Level (MML) charts on higher time frames can be a useful market internal tool as price action moves amongst fractal levels from hourly to daily charts. Confluence of levels may be levels of support/resistance or opportunities for a breakout move.

CHARTS: Weekly, Daily; 4hour


MML Levels (NQ)

Nearest Open Daily Gap: 5121.25

Lowest Open Gap: 4017


            continue reading on the next page…

The post Stock Market Futures Weekly Outlook: February 6 appeared first on See It Market.


Stock Market Futures Weekly Outlook: February 13

$
0
0

THE BIG PICTURE 

Relentless.

The indices roaring to new highs three out of the five trading days this past week… and with no regard to even entertaining the possibility of any self correction. This is a pattern we have become accustomed – to the bewilderment of many. With 2017 not giving more than a 1% move in the ES daily, finally breaking out on Thursday to lead the indices higher helped to make week six another historical week.

Each week, I point to the catalysts that may spawn a move in either direction and yet another week of grinding in the AM sessions to the eventual breakout, can lead the intraday technical trader to question on any given day, is this the day we pullback? I can’t stress enough to leave the bias at the door and simply watch the charts in front of you and not “guess” if this is the day. Leave the emotions aside of we can’t be this high in the market as we have experienced a runaway train that seems to not let up.

Article after article, post after post, tweet after tweet, the common thread that we just can’t push the market any higher becomes daunting. Reminds me of the ever-looming year 2K where the world was going to fall apart, and planes would fall out of the sky. We seemed to have survived.  If I had subscribed to this thinking back in November, 2016, I’d still be sitting on the sidelines. Now don’t get me wrong. I am as ready as anyone else for the market to pullback, close out open gaps below, and reset itself to move even higher. However, it is not for me to guess the WHY we are at the highs, but to simply be ready for both directions. This is the benefit to the intraday trader.

The following analogy best describes how I see the market these days. If you imagine one squeezing an orange for a cup of juice to quench their thirst, it would not take but a moment to get the essence of the orange in the glass. For some, taking an extra moment to squeeze even more, will render a fuller glass. Then there are those that will peel the entire orange and get every bit of pulp out which takes time. This is where in my opinion we sit technically on the indices. We have squeezed quite hard and while we have gotten alot of juice out of the market, there is still more pulp to squeeze as every day still opens an opportunity with a level upside on either the MML or Fibonacci levels. Sure, there are those that are screaming, there is nothing left to squeeze, but until I have gotten every part out of that fruit, we stay the course.

I surely can make the case that we head higher in week 7 with momentum clearly holding the course and intraday pullbacks being bought right back up to close upside or flat however, on the economic front for week seven, I walk tepidly in the first half of the week and await the reaction in the second half. Monday is light on the economic front followed with testimony by Chair Yellen on both Tuesday and Wednesday with the posse of fed speakers as well that can light up the ALGO’s searching for any key word that may be dropped in hints of rate hikes for 2017. Throw in the VIX open strike prices of 21-23 for Feb15 with over 1 million open interest, may just what the market needs to pullback.

Bottom Line

Technical momentum probability CONTINUES to remain at this point to lead us a higher on the indices “with EXTREME caution” on the bigger pic in my humble opinion if all things remain constant and nothing occurs to shake things up downside as stated over the last several weeks. At this point it won’t take much as stated above! I state with caution as seen in the charts below we are at a technical momentum decision time as we have been week after week based on my strategy that puts price action in a stall at these levels. I will be ready to alert of the change in trend or continued movement upside through social media and daily outlook.

For the Indices ETF or long term holder, different rules may apply as quarterly re-balancing is my preference for managing such markets. Option to move trailing stops to key MML, Fibonacci or moving average levels can lock in more profit if and when a pullback may occur.


Note that you can also view my market outlook for ES, YM, and NQ on YouTube.

Attempting to determine which way a market will go on any given day is merely a guess in which some will get it right and some will get it wrong. Being prepared in either direction intraday for the strongest probable trend is by plotting your longer term charts and utilizing an indicator of choice on the lower time frame to identify the setup and remaining in the trade that much longer. Any chart posted here is merely a snapshot of current technical momentum and not indicative of where price may lead forward.


NQ – Nasdaq Futures

Technical Momentum: UPTREND

Using the Murray Math Level (MML) charts on higher time frames can be a useful market internal tool as price action moves amongst fractal levels from hourly to daily charts. Confluence of levels may be levels of support/resistance or opportunities for a breakout move.

CHARTS: Daily; 4 hour


MML Levels (NQ)

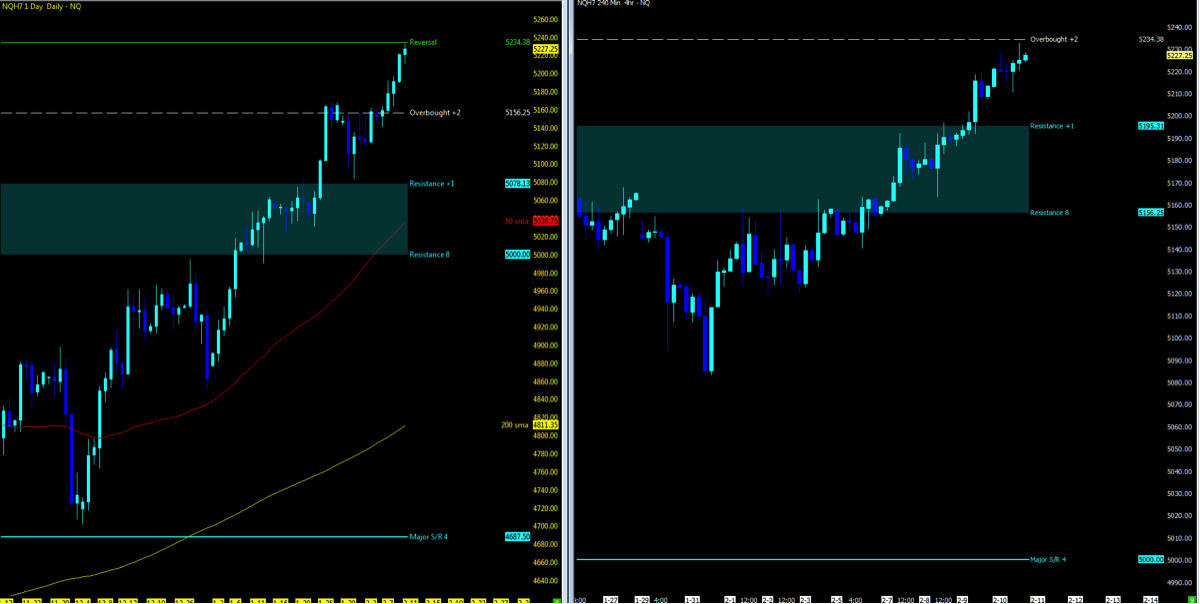
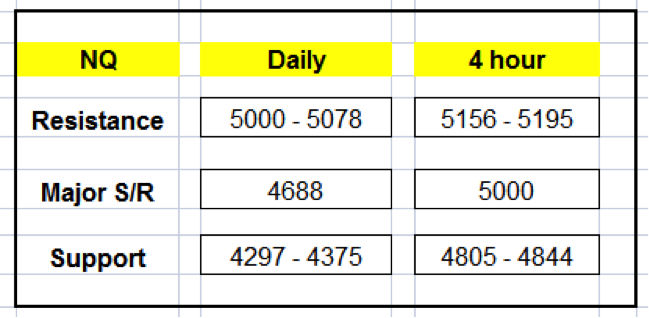
5234: Daily Reversal; 4 Hour “Overbought”

Nearest Open Daily Gap: 5121.25

Lowest Open Gap: 4017


ES – S&P Futures

Technical Momentum: UPTREND


MML Levels (ES)

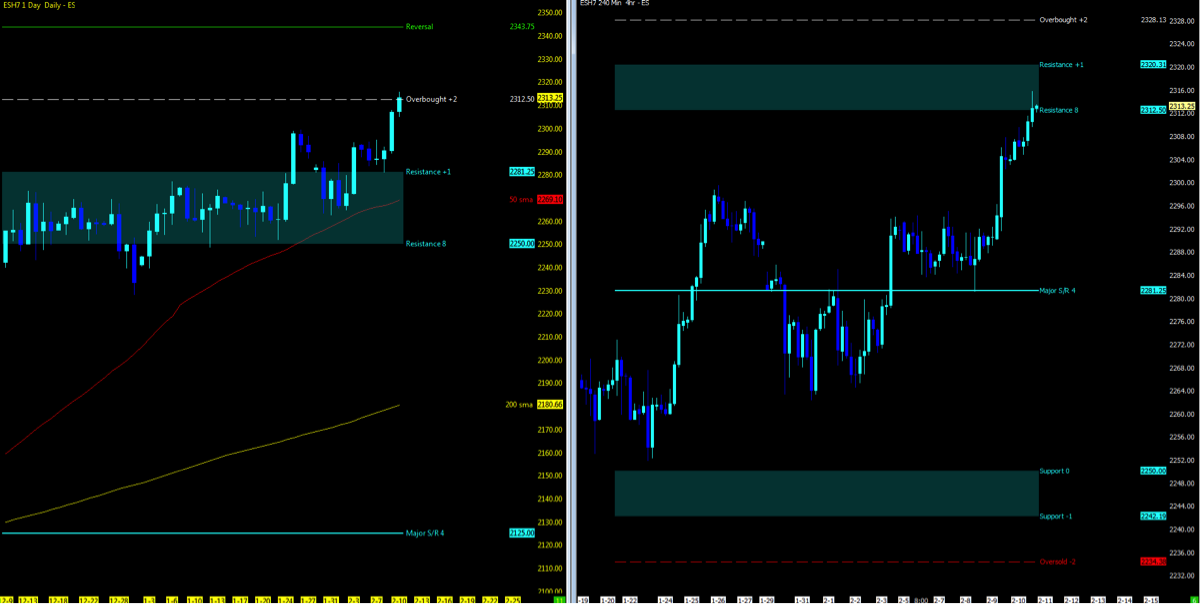
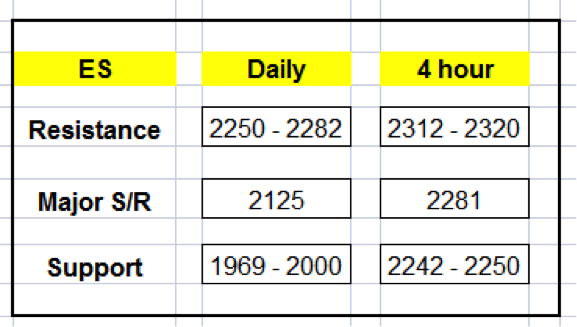
2312: Daily “Overbought”; 4 hr Resistance


Nearest Open Daily Gap: 2292

Lowest Open Gap: 1860.75


Thanks for reading and remember to always use a stop at/around key technical trend levels.


Twitter:  @TradingFibz

The author trades futures intraday and may have a position in the mentioned securities at the time of publication. Any opinions expressed herein are solely those of the author, and do not in any way represent the views or opinions of any other person or entity.


The post Stock Market Futures Weekly Outlook: February 13 appeared first on See It Market.

Stock Market Futures Weekly Outlook – February 20

$
0
0

THE BIG PICTURE 

We’ve seen seven relentless trending weeks to the upside to start 2017.  And last week was par for the course – the S&P 500 (INDEXSP:.INX) and Nasdaq (INDEXNASDAQ:.IXIC) closed at new all-time highs. In all, it’s been 15 weeks of nothing but one direction in the major US stock indices. This market refuses to entertain a pullback at this time.

Last week I alluded to an analogy of the market these past weeks like an orange being squeezed for every last pulp. It appears that while the bottom line picture last week was a continued uptrend (cautiously), the market continues to desire every last pulp out of this run. Could this be the week where markets finally ease off? Is week eight of 2017 finally going to be the one that gives us a bit of reprieve and “breathing” room to pull back and let the market digest?

I must say I have been thoroughly entertained by the numerous articles, tweets and posts by the Permabears and to those that finally could not hedge short any longer. Article after article covering everything from the VIX to the HFXAX (small cap futures hedge) raising cause of why the markets should pullback. Even I was drawn into watching the VIX FEB15 strike calls with Open Interest sitting at 1 million around 20-23. Seemed like a reasonable awareness given the relentless run and thinking perhaps those VIX levels may just rise to be in the money. Then again, perhaps just an insurance hedge in this upside run which ended being out of the money.

While the intraday charts are all I need to guide me in the TREND, looking ahead is simply knowing what obstacles in the market may give rise to any potential change of course. For instance, one may get in their car on any given day and be prepared to drive down the road on cruise, but what lies around the corner will only be known when it arrives… and we encounter any unforeseen events. Sure, you can decide to simply turn around and go the other way or travel much slower as you drive, but your management both as a driver on the road and as a trader in the market should prepare you for every situation.

Technically the trend has been strong and any trend study will surely note the same. As we continue to push to new highs, I turn to my most reliable indicator: the Heikin Ashi trend bars on both the range charts and 15/60m MML levels.

If we do turn lower, there are plenty of open gaps below, MML, Fib levels and 50/200 day moving averages to retrace to (and put on your radar).

But until then… we must leave our bias at the door. We need to simply watch the charts in front of us – they will put us in a place of being ready in both directions. As Livermore said, we are all looking for someone to tell us what to do in the markets. I encourage you to stop looking for someone to tell you which way the market trend is headed next week as not one single person knows what lies around the corner until we get there. Follow price, use your indicators and manage risk.

Note that you can also view my market outlook for ES, YM, and NQ on YouTube.

Attempting to determine which way a market will go on any given day is merely a guess in which some will get it right and some will get it wrong. Being prepared in either direction intraday for the strongest probable trend is by plotting your longer term charts and utilizing an indicator of choice on the lower time frame to identify the setup and remaining in the trade that much longer. Any chart posted here is merely a snapshot of current technical momentum and not indicative of where price may lead forward.

NQ – Nasdaq Futures

Technical Momentum: UPTREND

Using the Murray Math Level (MML) charts on higher time frames can be a useful market internal tool as price action moves amongst fractal levels from hourly to daily charts. Confluence of levels may be levels of support/resistance or opportunities for a breakout move.

CHART: Daily; 4 hour


MML Levels (NQ)

Nearest Open Daily Gap: 5232.5

Lowest Open Gap: 4017


ES – S&P Futures

Technical Momentum: UPTREND

CHART: Daily; 4 hour


MML Levels (ES)

Nearest Open Daily Gap: 2315.75

Lowest Open Gap: 1860.75


Thanks for reading and remember to always use a stop at/around key technical trend levels.

Twitter:  @TradingFibz

The author trades futures intraday and may have a position in the mentioned securities at the time of publication. Any opinions expressed herein are solely those of the author, and do not in any way represent the views or opinions of any other person or entity.


The post Stock Market Futures Weekly Outlook – February 20 appeared first on See It Market.

Nasdaq and S&P 500 Futures Weekly Trend Outlook – February 27

$
0
0

THE BIG PICTURE:  Pullback…short lived!

No, it couldn’t be. I can’t remember the last price action to the downside of more than 50 ticks and it FINALLY happened to us this past week. However, as with any relentless TREND, it was short lived and the market managed to not only recover in the same day but almost back up to all time highs to close out the week.

If you have been following my analogy of the Orange Squeeze the last several weeks, it appears we have found some more pulp out of this market. Last week I alluded and entertained the idea that the market may actually ease off a bit. Well, at least a one day reprieve was good enough to satisfy that palette. However it seems apparent (at this point) that the orange has more “juice” in it.

I remain quite amazed at the plethora of articles/posts/tweets that continue to flood the market of hatred and despair of how can this market continue to move up with internals not in sync and volume not matching the history of a move such as the one we are in. But, for weeks on end they have been wrong.

So let’s put this to rest – here’s my 3 cents. Day and day out, I reiterate to leave your BIAS at the door when trading and ONLY watch the charts in front of you. This is best defined as, no matter where you think the market should be, watching trend each day and being ready in both directions. It will keep your emotions out of the ongoing permabear influence and have you focused on making ticks. Whatever strategy you may have, it is recognizing the market will move where it wants and you have NO CONTROL over it. The only piece you can manage is your process and risk management.

I can throw at you several books to read and posts by Steve Burns that will simply reiterate what patient and disciplined traders alike are instilled with. I think many active investors would prefer the market to pull back and close out the lower open gaps before moving higher. That sounds nice, but until that time, I’m happy knowing what the trend looks like and seeking setups with trade management that allow me to ride the trend wave.

Week nine appears to be a bit heavier on the economic front than week 8. Tax reform announcement, March contract expiration nearing, GDP, non-farm payrolls, multiple fed reserve speakers and the prospect for a next rate hike are all upcoming economic events that remain on my radar alert.

Technically, we remain near the highs with serious open gaps below. VIX levels remain low and almost pointless of indicating when the market will finally turn. The daily charts on the indices clearly paint that picture as we hold above the respective 50/200 day moving averages. The 4 hour MML charts which support the bigger trend on a lower time frame also remain at the highs and continue to remain in a very tight range. The globex sessions which have been a solid ground for trend setups with the London open, but never indicative of where we are headed in the US session (a great example from at least two days this past week). As we continue to push at the highs, and looking to the smaller time frames for every inch of how much more it can go, has been my most reliable indicator by use of the Heikin Ashi trend bars on both the range charts and 15/60m MML levels.

The Bottom Line

This is a tough one to swallow but until the market shows evidence of distribution, there is only one TREND at this point.

Technical momentum probability CONTINUES to lead us higher on the indices on the bigger picture. That said, watch your trending indicators if we pull back again.

I state with caution as seen in the charts below we are at a technical momentum decision time as we have been week after week based on my strategy that puts price action in a stall at these upper levels. I will be ready to alert of the change in trend or continued movement upside through social media and my daily outlook; 15 minutes prior to the open.

For the Indices ETF or long term holder, different rules may apply as quarterly re-balancing is my preference for managing such markets. Option to move trailing stops to key MML, Fibonacci or moving average levels can lock in more profit if and when a pullback may occur. Placing a 250 sma on your daily/longer term range charts can be one useful indicator before institutional support and taking in more profit.

Note that you can also view my market outlook for ES, YM, and NQ on YouTube.

Attempting to determine which way a market will go on any given day is merely a guess in which some will get it right and some will get it wrong. Being prepared in either direction intraday for the strongest probable trend is by plotting your longer term charts and utilizing an indicator of choice on the lower time frame to identify the setup and remaining in the trade that much longer. Any chart posted here is merely a snapshot of current technical momentum and not indicative of where price may lead forward.


NQ – Nasdaq Futures

Technical Momentum: UPTREND

Using the Murray Math Level (MML) charts on higher time frames can be a useful market internal tool as price action moves amongst fractal levels from hourly to daily charts. Confluence of levels may be levels of support/resistance or opportunities for a breakout move.

CHARTS: Daily; 4 hour


MML Levels (NQ)

NASDAQ Trading Levels TABLE

Nearest Open Daily Gap: 5232.5

Lowest Open Gap: 4017


ES – S&P Futures

Technical Momentum: UPTREND


MML Levels (ES)

Nearest Open Daily Gap: 2348.75

Lowest Open Gap: 1860.75


Thanks for reading and remember to always use a stop at/around key technical trend levels.

Twitter:  @TradingFibz

The author trades futures intraday and may have a position in the mentioned securities at the time of publication. Any opinions expressed herein are solely those of the author, and do not in any way represent the views or opinions of any other person or entity.


The post Nasdaq and S&P 500 Futures Weekly Trend Outlook – February 27 appeared first on See It Market.

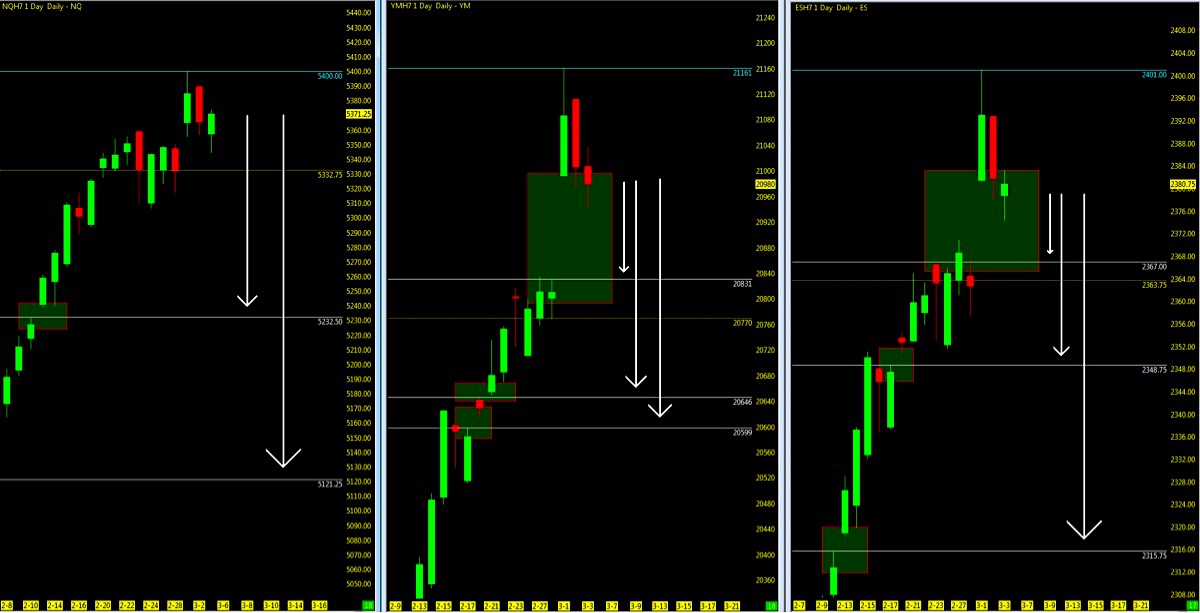
Stock Market Futures Weekly Trend Outlook – March 6

$
0
0

THE BIG PICTURE 

Serious Open Gaps!

For weeks now I have been commenting on how relentless the market has been without any durable pullbacks.  Even in week 9 the market managed to push up to higher highs once again… but caution remains as key events on the horizon may be just the catalyst we need to pull back and correct the market to its nearest open gaps.

While remaining open gaps may be an entirely another article to write, I mention it here briefly in awareness that the US stock market indices will at some point need to close out “unfinished business” before rallying higher once more.

Now, some of you may disagree with me and that is fine and your right to do so, however when it comes to the indices, 100% of ALL regular trading hour open gaps EVENTUALLY get filled. So I believe you should at least be aware of this (if not prepared) as it WILL happen at some point. It’s not a matter of if, but when. What concerns me more is that while the further we pull away from these lower levels, the drop at one point will be more substantial and “painful”. That said, this will be a fantastic opportunity for the long term trader to average in at lower price. In sum, be mindful of stops and that markets move in both directions.

Week 10 is one step closer to the contract rollover and non-farm payrolls report on Friday. The obvious prospect for a rate hike is enough to put this on a traders radar.

Technically, we remain near the highs after a midweek pullback with serious open gaps remaining below as highlighted above. VIX levels still remain low and almost pointless of indicating when the market will turn as it doesn’t seem to be correlated to one another most recently. The daily charts on the indices clearly paint that picture as we hold above the respective 10/50/200 ma’s. The 4 hour MML charts which support the bigger trend on a lower time frame also remain at the highs and continue to remain in a very tight range. Watch for the SPX 2400 strike calls Open Interest mid month as I can see the ES retesting the upper levels.

The Bottom Line

Until the market shows evidence of distribution, there is only one TREND at this point. There’s a probability of at least a pullback to close out last week’s open gap before moving higher.


Note that you can also view my market outlook for ES, YM, NQ, CL, GC, 6J, and 6E on YouTube.

Attempting to determine which way a market will go on any given day is merely a guess in which some will get it right and some will get it wrong. Being prepared in either direction intraday for the strongest probable trend is by plotting your longer term charts and utilizing an indicator of choice on the lower time frame to identify the setup and remaining in the trade that much longer. Any chart posted here is merely a snapshot of current technical momentum and not indicative of where price may lead forward.


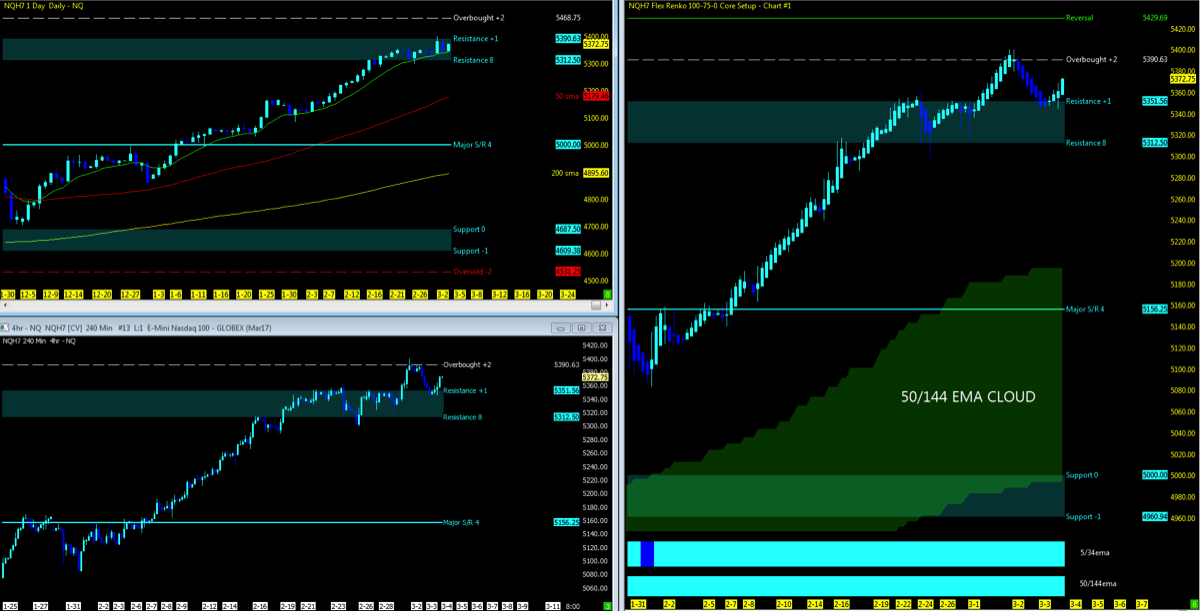
NQ – Nasdaq Futures

Technical Momentum: UPTREND

Using the Murray Math Level (MML) charts on higher time frames can be a useful market internal tool as price action moves amongst fractal levels from hourly to daily charts. Confluence of levels may be levels of support/resistance or opportunities for a breakout move.

CHARTS: Daily; Range; 4hr


Nearest Open Daily Gap: 5232.5

Lowest Open Gap: 4017


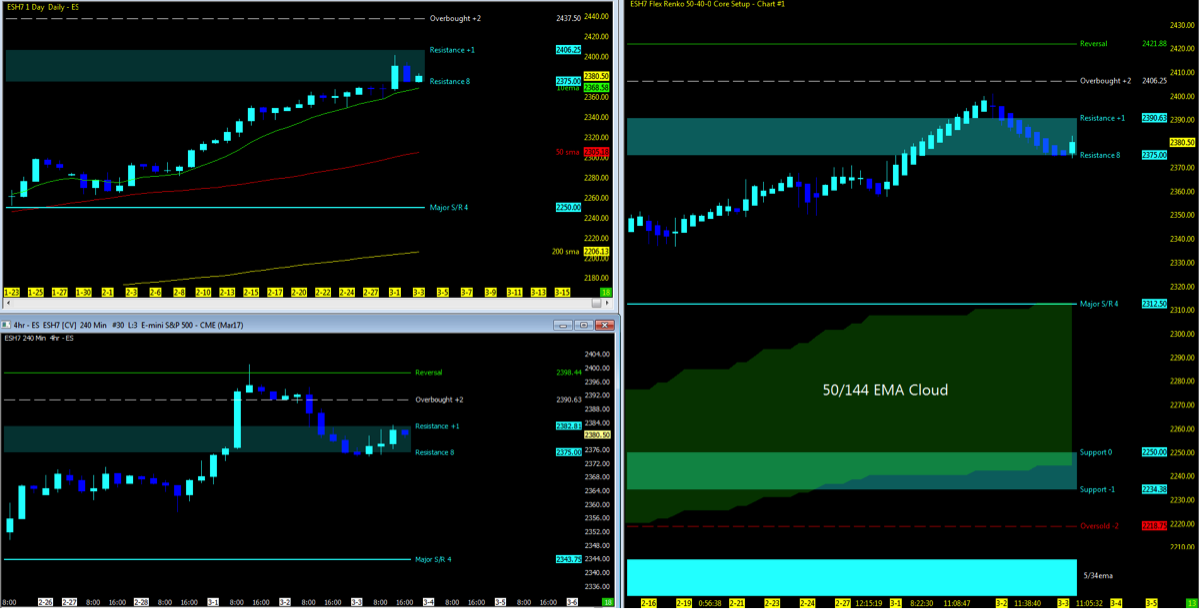
ES – S&P Futures

Technical Momentum: UPTREND


Nearest Open Daily Gap: 2348.75

Lowest Open Gap: 1860.75


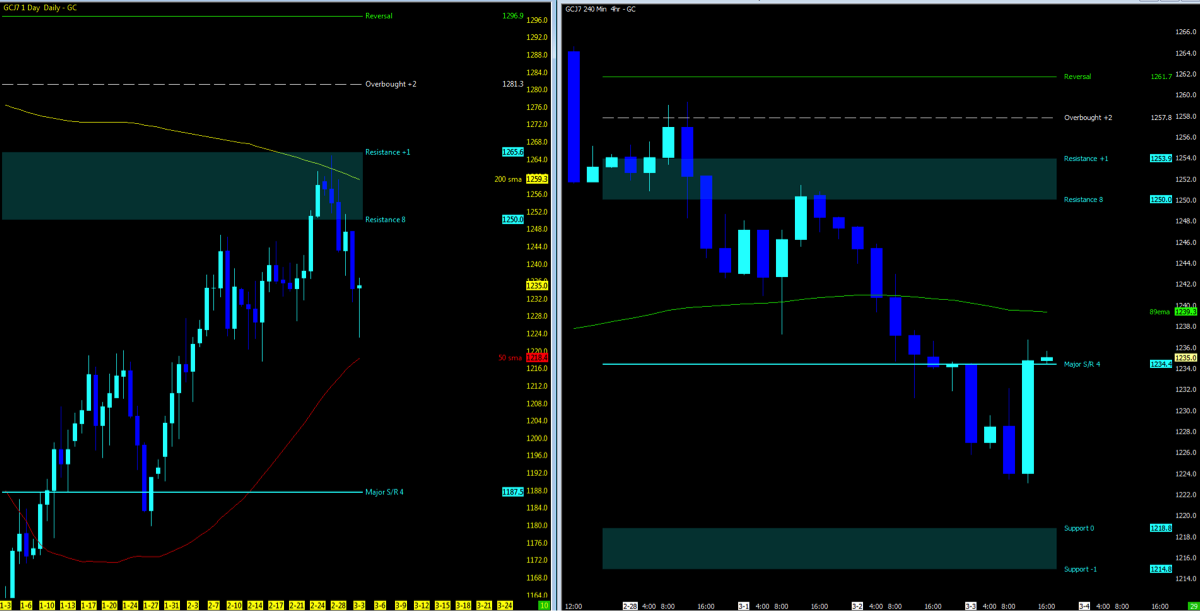
GC – GOLD Futures

Technical Momentum: DOWNTREND

CHARTS: Daily; 4hr


Thanks for reading and remember to always use a stop at/around key technical trend levels.

Twitter:  @TradingFibz

The author trades futures intraday and may have a position in the mentioned securities at the time of publication. Any opinions expressed herein are solely those of the author, and do not in any way represent the views or opinions of any other person or entity.


The post Stock Market Futures Weekly Trend Outlook – March 6 appeared first on See It Market.

Stock Market Futures Weekly Trend Outlook – March 13

$
0
0

THE BIG PICTURE 

Pullback Indeed!

Many have been hoping for a pullback for weeks, and week 10 delivered as stated in last week’s outlook, “key events on the horizon may be just the catalyst we need to pull back and correct the market to its nearest open gaps.” Open gaps may not be the end all to a pullback but surely something to watch if/when the stock market begins to trend lower as we have plenty more to come downside. The market surely has delivered a few moments of uncertainty but just when you begin to think that may be the catalyst needed to pullback, no such luck.

Luck brought us a brief reprieve last week but it was short lived once again on the stock market futures indices. Nasdaq futures (NQ) rose just shy of all time highs on Friday. S&P 500 futures (ES) and Dow Jones futures (YM) were not so lucky as they closed out under their perspective weekly opens. Heads up on the divergence into week 11.

With week 10 behind us and the ever looming non-farm payrolls data out as of last Friday, we remain in a pattern of uncertainty once again as the FOMC announcement approaches. Indices continue to remain on the higher time frame Murray Levels upside in what continues to be an ongoing  uptrend holding above each respective 50/144 ema and key moving averages (10, 50, 200). For no other reason than the fact that markets remain upside, even with the pullback noted above, the well monitored moving averages keep my perspective for the short term in the same direction. Once price action pulls back on the 4 hour chart under key noted levels in Week 11’s video outlook, I will default to the daily chart and watch for any price action closing in on the moving averages and daily gaps. Upside action definitely has room as the YM and ES may revisit and retest the all-time highs achieved most recently.

Interesting to note that the VIX Volatility Index (INDEXCBOE:VIX) has remained below 20 for 121 straight days – a streak not seen since 2011. Does this mean things are great/worrisome? I don’t know – who am I to question? As a technical trader, I simply resort to my charts to be ready for both directions and use the Heikin Ashi bars in trend as my indicator.

Looking ahead to week 11, VIX levels remain low and perhaps adding to its already growing number of days below 20 will keep this market afloat and above its perspective moving averages, both on a daily and range charts. Key events in the market this week include FOMC and a heavy duty Wednesday on the economic front. This week also is are quarterly Quad Witching event and all eyes on the SPX 2400 strike calls Open Interest mid month as we may  see the ES retesting the upper levels.

The Bottom Line:   FOMC is the event to watch. Until then, TREND remains upside as the dips continue to be bought with considerable momentum back to the upside.

Technical momentum probability REMAINS at this point to lead us higher on the indices on the bigger picture if all things remain constant and nothing occurs to “shake things up” downside. However, early signs of weakness have started to show. Watch for the break of the daily 10ma downside or revisiting the all time highs in the opposite direction.

Observe the intraday on the 60/15m charts for any alert of the change in trend or continued movement upside. I will continue notify through social media and my daily outlook; posted 15 minutes prior to the US open of any updates throughout the week.

For the longer term holder, different rules may apply as quarterly re-balancing which is approaching and is my preference for managing such markets. Option to move trailing stops to key MML, Fibonacci or moving average levels can lock in more profit if and when a pullback may occur. Placing a 250 sma/VWAP on your daily/longer term range charts can be one useful indicator before institutional support and taking in more profit.

Note that you can also view my market outlook for ES, YM, NQ, CL, GC, 6J, and 6E on YouTube.

Attempting to determine which way a market will go on any given day is merely a guess in which some will get it right and some will get it wrong. Being prepared in either direction intraday for the strongest probable trend is by plotting your longer term charts and utilizing an indicator of choice on the lower time frame to identify the setup and remaining in the trade that much longer. Any chart posted here is merely a snapshot of current technical momentum and not indicative of where price may lead forward.


NQ – Nasdaq Futures

Technical Momentum: UPTREND

Using the Murray Math Level (MML) charts on higher time frames can be a useful market internal tool as price action moves amongst fractal levels from hourly to daily charts. Confluence of levels may be levels of support/resistance or opportunities for a breakout move.

CHARTS: Daily; Range; 4hr

Nearest Open Daily Gap: 5232.5

Lowest Open Gap: 4017


ES – S&P Futures

Technical Momentum: UPTREND

Nearest Open Daily Gap: 2348.75

Lowest Open Gap: 1860.75


Thanks for reading and remember to always use a stop at/around key technical trend levels.

Twitter:  @TradingFibz

The author trades futures intraday and may have a position in the mentioned securities at the time of publication. Any opinions expressed herein are solely those of the author, and do not in any way represent the views or opinions of any other person or entity.


The post Stock Market Futures Weekly Trend Outlook – March 13 appeared first on See It Market.

Stock Market Futures Weekly Trend Analysis – March 19

$
0
0

THE BIG PICTURE

Q1 – what a ride!

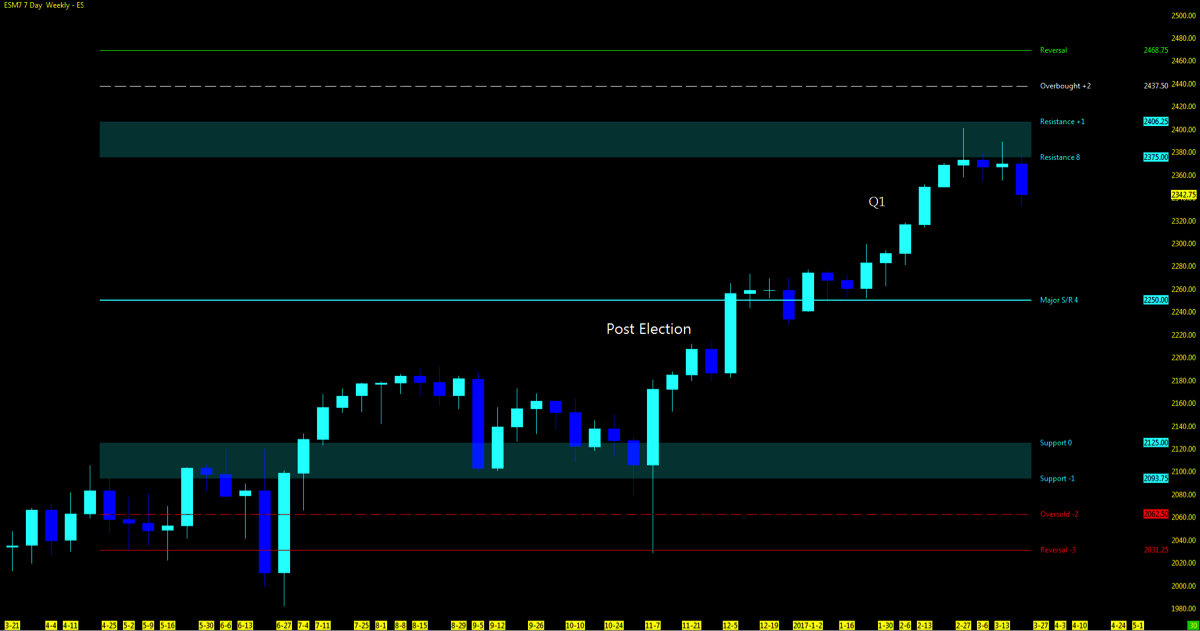
Looking at the weekly chart of the S&P 500 futures (below), it has been nothing but relentless price momentum upside with the casual minor pullback on a S&P 500 (INDEXSP:.INX) daily chart.


Permabears have been littering the twitter waves for months now waving their “bubble” flags in hopes that the day will be sooner rather than later that they told you so. The count is endless in the number of technical signals that have been broadcasted that have simply been run over and right through as we have pushed the limits of the market. Overvaluations, overbought and the next big short; all common terms and themes to make headlines (in hopes that they were the ones that called it first).

Meanwhile, my IJR and TQQQ holdings continue to reap the benefits of this momentum move based on Jason Kelly’s quarter re-balancing. Had I listened to any of the naysayers starting back in 2014, I would have missed on the gains I have attributed during the market’s rally, illogical as it may be to many of you. I keep it simple Jedi traders. The hopes of a deeper pullback would have been well timed to close out open gaps that I have mentioned in my previous weekly outlooks. But we have yet to see that.

Either way, one fact is for sure and will be rehashed for years to come, the rally that went against all the rules is in the books.


#NowWhat?

Looking ahead to week 12, you can see that the Nasdaq (INDEXNASDAQ:.IXIC) has made new highs while the S&P and Dow haven’t. VIX levels continue to remain low as technical indicators by my charts have just enough reason to go in either direction. I know that is not what you want to hear, but consolidation is exactly that. Key events in the market this week include Federal reserve speakers and a steady diet of Washington politics and news… this seems to be playing a bigger role in 2017.

Watch those daily/weekly and monthly VWAP for support and resistance both intraday and the higher time frames.

Bottom Line:  Watch for any pullbacks to the open gaps on the YM or ES. If the daily lows continue to be bought and lifted, TREND will remain upside and may retest the perspective all time highs.

Note that you can also view my market outlook on YouTube.

Attempting to determine which way a market will go on any given day is merely a guess in which some will get it right and some will get it wrong. Being prepared in either direction intraday for the strongest probable trend is by plotting your longer term charts and utilizing an indicator of choice on the lower time frame to identify the setup and remaining in the trade that much longer. Any chart posted here is merely a snapshot of current technical momentum and not indicative of where price may lead forward.


NQ – Nasdaq Futures

Technical Momentum: UPTREND

Using the Murray Math Level (MML) charts on higher time frames can be a useful market internal tool as price action moves amongst fractal levels from hourly to daily charts. Confluence of levels may be levels of support/resistance or opportunities for a breakout move.

  • CHARTS: Daily; Range; 4hr

Nearest Open Daily Gap: 5232.5

Lowest Open Gap: 4017


ES – S&P Futures

Technical Momentum: UPTREND

Nearest Open Daily Gap: 22365.50//2348.75

Lowest Open Gap: 1860.75


Thanks for reading and remember to always use a stop at/around key technical trend levels.


Twitter:  @TradingFibz

The author trades futures intraday and may have a position in the mentioned securities at the time of publication. Any opinions expressed herein are solely those of the author, and do not in any way represent the views or opinions of any other person or entity.


The post Stock Market Futures Weekly Trend Analysis – March 19 appeared first on See It Market.
Stock Market Futures Weekly Trend Analysis – March 27

$
0
0

THE BIG PICTURE

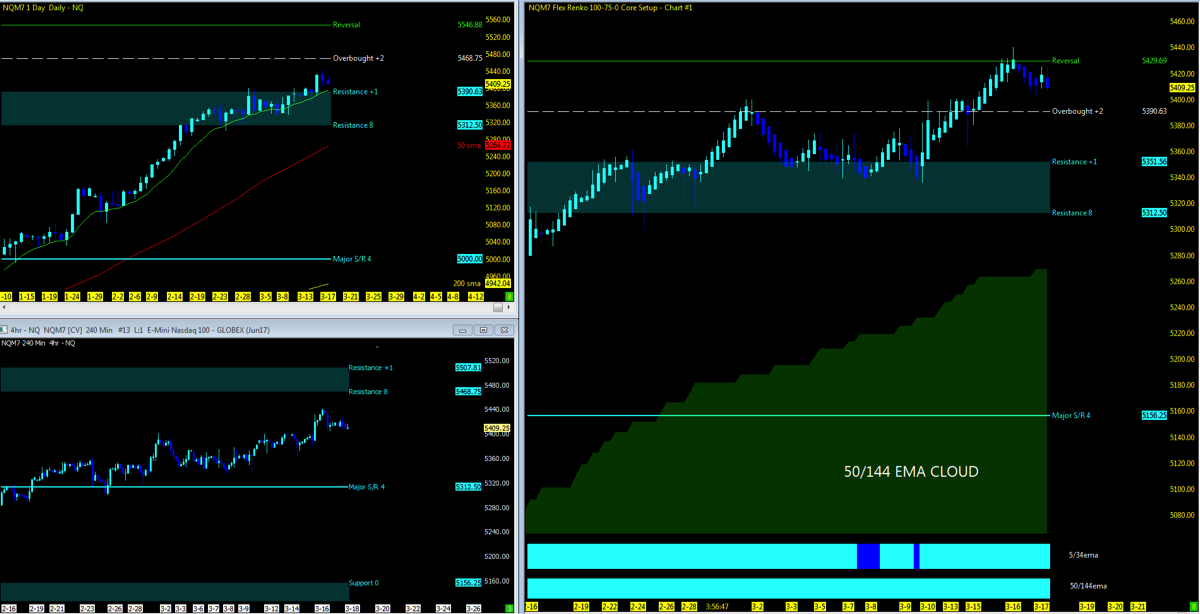
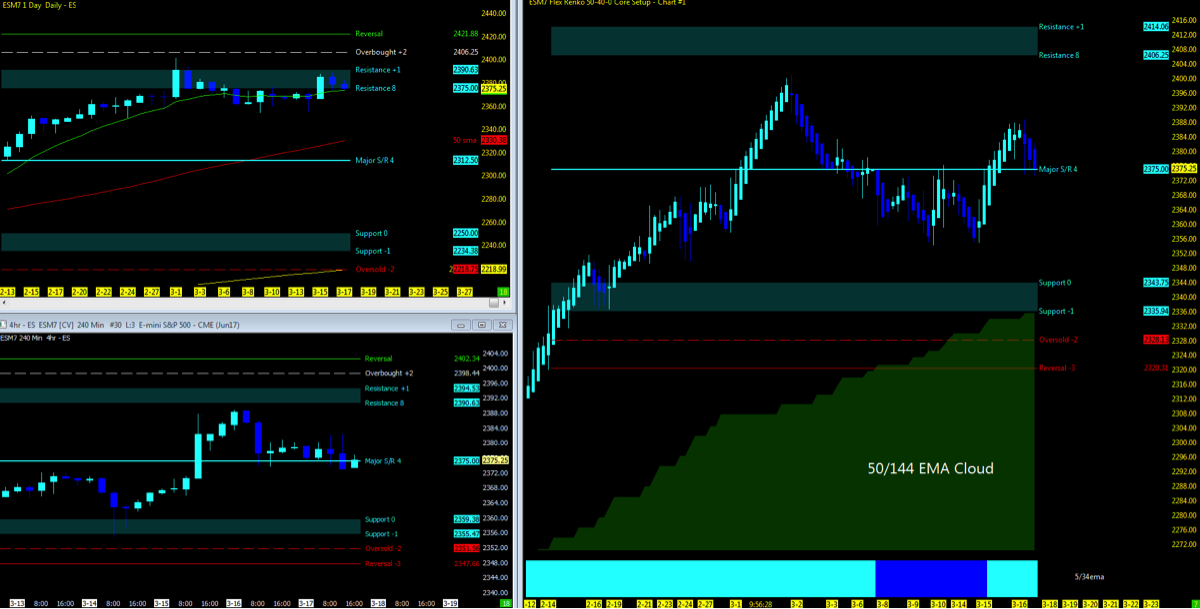
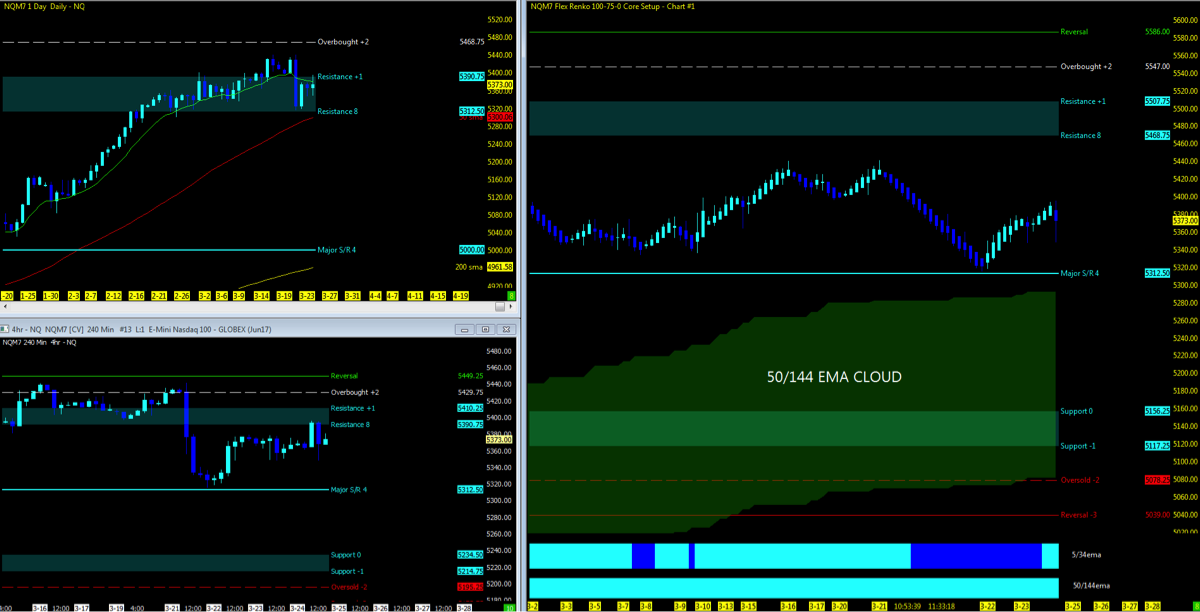
With week 12 in the books, the major stock market indices continue to a pullback withing a broader move to the upside – an ongoing uptrend holding above each indices respective 50/144 ema and key moving averages (50, 200) on higher time frames. Note that you can find last week’s recap here.

The 10 day moving average has lost support on both the Dow Jones Futures (YM) and S&P 500 Futures (ES); a first indicator of a near-term trend break. This adds caution near-term for the S&P 500 (INDEXSP:.INX).

The ES which has found significant resistance on a weekly MML chart has a 50% probability of a pullback to major support/resistance at 2250 if the 50 day moving average is unable to hold. This would put the ES in proximity of its’ 200 day moving average, not seen since November of 2016.  Here’s a longer term trend chart.

The VIX Volatility Index (INDEXCBOE:VIX) levels continue to remain low in the high 12’s (a concern). With the health care legislation out of the way for now and not for the better, the three biggies which seem to loom over the market from an economic reform standpoint include taxes, infrastructure and trade. This is where the market thought it would see change, and unless something significant comes out of these headliners, price action may struggle at these highs.

Key events on the horizon include Federal reserve speakers, GDP and Brexit (so watch for volatility). Don’t rule out Washington politics and worldly imbalance to set the market in motion.

The Bottom Line

Watch price action around the daily 50ma on market indices. If unable to hold, price action may seek support around 50% pullback and open gaps. Upside action look for price to regain the 10dma and push above.

Technical momentum probability REMAINS in an UPTREND on the bigger picture. Signs of market weakness started to show in week 11 and followed through in week 12. Observe the intraday on the 60/15m charts for any alert of the change in trend or continued movement upside. I will continue notify through social media and my daily outlook; posted 15 minutes prior to the US open of any updates throughout the week.

For the Indices ETF or long term holder, different rules may apply as quarterly re-balancing which is approaching and is my preference for managing such markets. Option to move trailing stops to key MML, Fibonacci or moving average levels can lock in more profit if and when a pullback may occur.

Note that you can also view my market outlook on YouTube.  Markets Covered: ES, YM, NQ, GC, CL

Attempting to determine which way a market will go on any given day is merely a guess in which some will get it right and some will get it wrong. Being prepared in either direction intraday for the strongest probable trend is by plotting your longer term charts and utilizing an indicator of choice on the lower time frame to identify the setup and remaining in the trade that much longer. Any chart posted here is merely a snapshot of current technical momentum and not indicative of where price may lead forward.


NQ – Nasdaq Futures

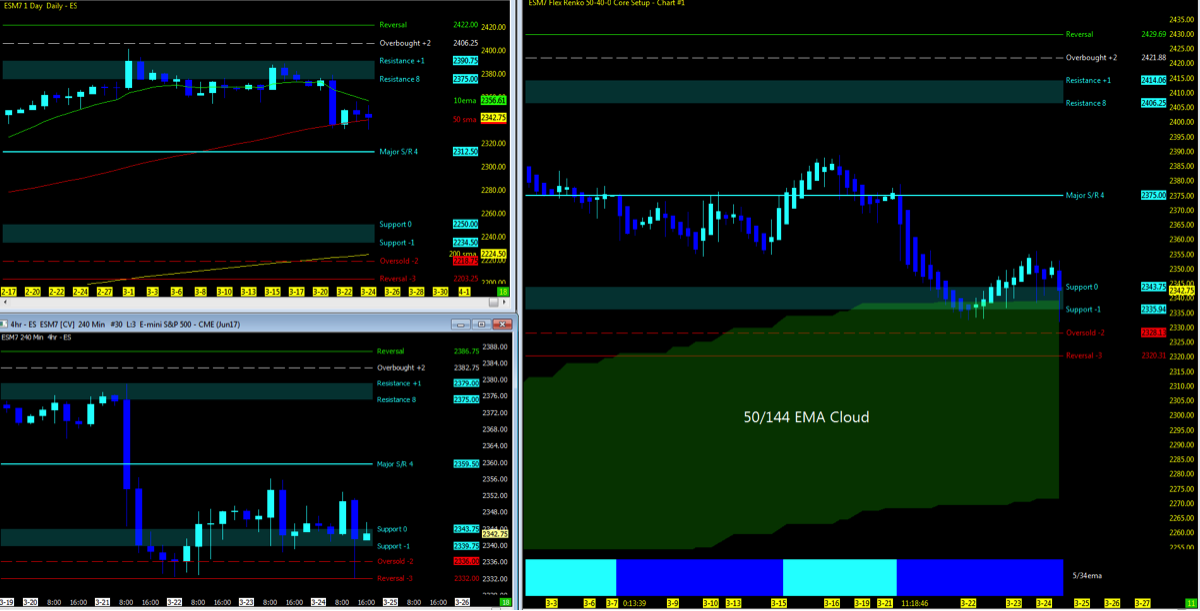
Technical Momentum: UPTREND Pullback

Note that using the Murray Math Level (MML) charts on higher time frames can be a useful market internal tool as price action moves amongst fractal levels from hourly to daily charts. Confluence of levels may be levels of support/resistance or opportunities for a breakout move.   CHARTS: Daily; Range; 4hr

Nearest Open Daily Gap: 5232.5

Lowest Open Gap: 4017


ES – S&P Futures

Technical Momentum: UPTREND Pullback

Nearest Open Daily Gap: 2315.75

Lowest Open Gap: 1860.75


YM – DOW Futures

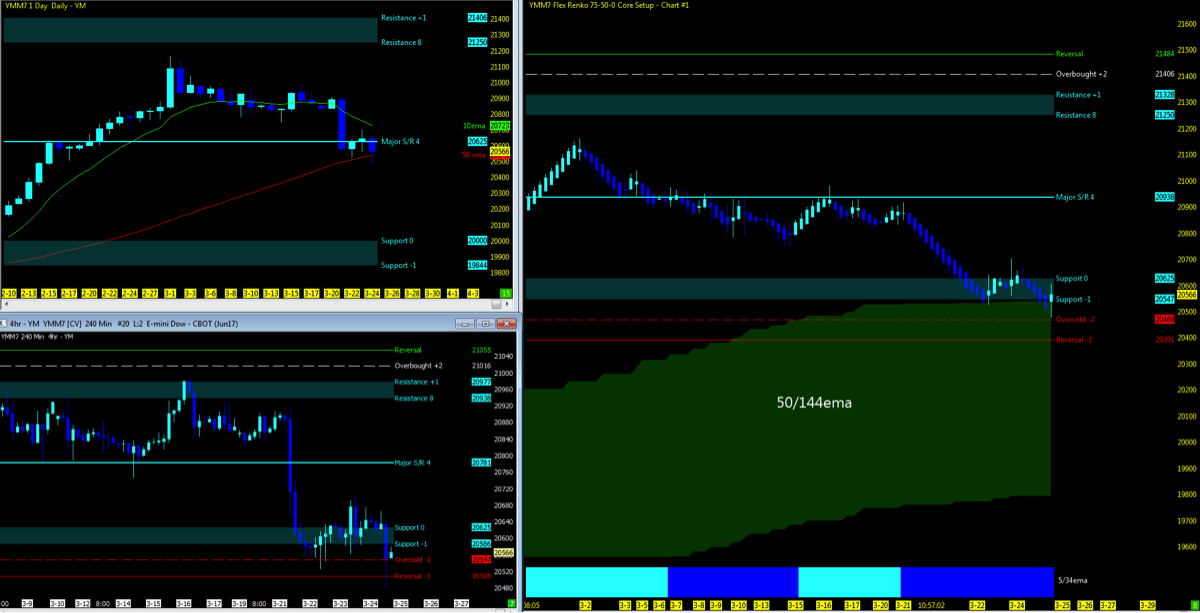
Technical Momentum: UPTREND Pullback

Nearest Open Daily Gap: 20248

Lowest Open Gap: 15924


Thanks for reading and remember to always use a stop at/around key technical trend levels.


Twitter:  @TradingFibz

The author trades futures intraday and may have a position in the mentioned securities at the time of publication. Any opinions expressed herein are solely those of the author, and do not in any way represent the views or opinions of any other person or entity.


The post Stock Market Futures Weekly Trend Analysis – March 27 appeared first on See It Market.

S&P 500 And Nasdaq Futures Weekly Trend Analysis – April 3

$
0
0

THE BIG PICTURE 

Week 13 is in the books and with it Q1 now rolls into Q2 for the markets. After a (failed) gap down to start the week, the stock market indices regained their footing and ended the week strong.

The rally allowed the S&P 500 (INDEXSP:.INX) and Nasdaq (INDEXNASDAQ:.IXIC) to remain in an ongoing uptrend holding above each indices 50/144 ema and key moving averages (50, 200) on higher time frames. Currently, the S&P 500 futures (ES) and Nasdaq futures (NQ) are back above their perspective 10 day moving averages with the struggling Dow Jones Futures (YM) right at the daily 10/50 and MML major support and resistance (see chart below).

The S&P 500 futures (ES), which worked it’s way from the MML lows to highs throughout the week, is holding above the weekly VWAP on an hourly chart. It found consolidation during the later part of week on low volume, and this brings pause to the end of the week rally (see below).

VIX levels continue to remain low swinging between 11 – 13. Rumors of the health care vote back in play and upcoming tax reform/infrastructure spending have yet to be seen. Unless something significant comes out of these economic headliners, price action may struggle at these levels. I remain focused at current levels, trying to tune out the plethora of naysayers and permabears that continue to plague social media with doomsday comments. At some point the indices will have to pull back and fill the open gaps that remain open below. Note that you can read more about my trend trading strategies on my website.

Key events in the market this week include FOMC minutes on Wednesday as the market continues to ponder the amount of rate hikes to come in 2017 and Friday’s non-farm payroll numbers. Federal reserve speakers which surely can move the market on any given day are spread throughout the week. Core Economic earnings for Q1 starts to role out  for the next 6 weeks, surely an indicator if the numbers are that great, which can also be smoke and mirrors at times. Don’t forget Washington politics and worldly imbalance to set the market in motion which by any other given year may be not be as newsworthy but continue to be playing a bigger role in 2017 as we have seen since Q4 of 2016.

…and last, the APRIL showers which by history tend to bring a bullish sentiment to the market has yet to be seen. Keep in mind that past performance is never indicative of future price action.

The Bottom Line

Watch price action around the daily 10/50ma on the ES/YM. If unable to hold, price action may seek support around 50% pullback (MML Major S/R) and open gaps below. Upside look to regain all time highs. NQ at the highs, with positive earnings numbers mid month will plow higher and until then, watch the 10dma for downside trend break and 50ma for support.

Technical momentum probability REMAINS in an UPTREND on the bigger picture. Signs of market weakness started to show in week 11 and 12 with a push back upside in week 13. Observe the intraday on the 60/15m charts for any alert of the change in trend or continued movement upside. Keep a weekly VWAP on the 60m chart to monitor trend change. I will continue notify through social media and my daily outlook; posted 15 minutes prior to the US open of any updates throughout the week.

Note that you can also view my market outlook on YouTube.  Markets Covered: ES, YM, NQ, GC, CL

Attempting to determine which way a market will go on any given day is merely a guess in which some will get it right and some will get it wrong. Being prepared in either direction intraday for the strongest probable trend is by plotting your longer term charts and utilizing an indicator of choice on the lower time frame to identify the setup and remaining in the trade that much longer. Any chart posted here is merely a snapshot of current technical momentum and not indicative of where price may lead forward.


NQ – Nasdaq Futures

Technical Momentum: UPTREND

Using the Murray Math Level (MML) charts on higher time frames can be a useful market internal tool as price action moves amongst fractal levels from hourly to daily charts. Confluence of levels may be levels of support/resistance or opportunities for a breakout move.  Charts below: Daily; Range; 4hr

Nearest Open Daily Gap: 5232.5

Lowest Open Gap: 4017


ES – S&P 500 Futures

Technical Momentum: UPTREND

Nearest Open Daily Gap: 2315.75

Lowest Open Gap: 1860.75

Thanks for reading and remember to always use a stop at/around key technical trend levels.


Twitter:  @TradingFibz

The author trades futures intraday and may have a position in the mentioned securities at the time of publication. Any opinions expressed herein are solely those of the author, and do not in any way represent the views or opinions of any other person or entity.


The post S&P 500 And Nasdaq Futures Weekly Trend Analysis – April 3 appeared first on See It Market.
Nasdaq and S&P 500 Futures Weekly Trend Analysis – April 10

$
0
0

THE BIG PICTURE – What Lies Ahead?

Stock market bears have an opening, but it’s just a matter of whether or not they take advantage of it. Thus far, they haven’t.

The S&P 500 (INDEXSP:.INX) is just 2 percent off all-time highs, while the Nasdaq Composite (INDEXNASDAQ:.IXIC) is just one percent. The Volatility Index (VIX) continues to remain subdued swinging between 11 – 13.  That said, there is a plethora of open gaps that remain below. But what will be the catalyst?  Like I have said for most of 2017, it won’t take much to spook the traders to sell off at these levels.

The technical charts remain consolidated in a month that has a historical record of being bullish. While past performance is never indicative of future price action, the market “appears” to be waiting for its opportune moment to make its next move. Big picture events to keep track of include tax reform and infrastructure spending. But if either stalls out, it may take a toll on this sustained and relentless rally. Any pullback at this juncture will look to the 200ma for the next major support or for the market to regain it’s footing above the 10/50ma which the NQ appears to be in command of after three new all time highs last week.

Key events in the market this week include Jolts and a Yellen speech. Core Economic earnings for Q1 start to role out over the next several weeks, surely an indicator to be aware of. And Washington politics and worldly imbalance should play an even bigger role in Q2 2017.

THE BOTTOM LINE

CLOSELY watch price action around the daily 10/50ma on the ES/YM. If unable to hold, price action may seek support on the next MML level downside. Keep in mind open gaps below. Upside look to regain all time highs as the NQ leads the charge. Lifting and maintaining price above the 10ma will be a positive indicator of market momentum back upside.

Technical momentum probability REMAINS in an UPTREND on the bigger picture. Signs of market weakness started to show in weeks 11 and 12, but we saw strength in week 13 and consolidation in week 14. I like to keep a weekly VWAP on the 60m chart to monitor trend change as in week 14 price action struggled to pull away. I will continue notify through social media and my daily outlook; posted 15 minutes prior to the US open of any updates throughout the week.

Note that you can also view my market outlook on YouTube.  Markets Covered: ES, YM, NQ, GC, CL

Attempting to determine which way a market will go on any given day is merely a guess in which some will get it right and some will get it wrong. Being prepared in either direction intraday for the strongest probable trend is by plotting your longer term charts and utilizing an indicator of choice on the lower time frame to identify the setup and remaining in the trade that much longer. Any chart posted here is merely a snapshot of current technical momentum and not indicative of where price may lead forward.


Nasdaq Futures – NQ

Technical Momentum: UPTREND

Using the Murray Math Level (MML) charts on higher time frames can be a useful market internal tool as price action moves amongst fractal levels from hourly to daily charts. Confluence of levels may be levels of support/resistance or opportunities for a breakout move.

CHARTS: Daily; Range; 4hr

Nearest Open Daily Gap: 5232.5

Lowest Open Gap: 4017


S&P 500 Futures – ES

Technical Momentum: UPTREND

Nearest Open Daily Gap: 2315.75

Lowest Open Gap: 1860.75


Thanks for reading and remember to always use a stop at/around key technical trend levels.

Twitter:  @TradingFibz

The author trades futures intraday and may have a position in the mentioned securities at the time of publication. Any opinions expressed herein are solely those of the author, and do not in any way represent the views or opinions of any other person or entity.


The post Nasdaq and S&P 500 Futures Weekly Trend Analysis – April 10 appeared first on See It Market.
Nasdaq Futures Weekly Trend Analysis & Outlook – April 17

$
0
0

THE BIG PICTURE – What’s Ahead?

The major stock market indices were unable to hold above the 10/50 ema and wound up finishing lower last week.  For the week, the market leading Nasdaq Composite (INDEXNASDAQ:.IXIC) closed lower -1.2%.

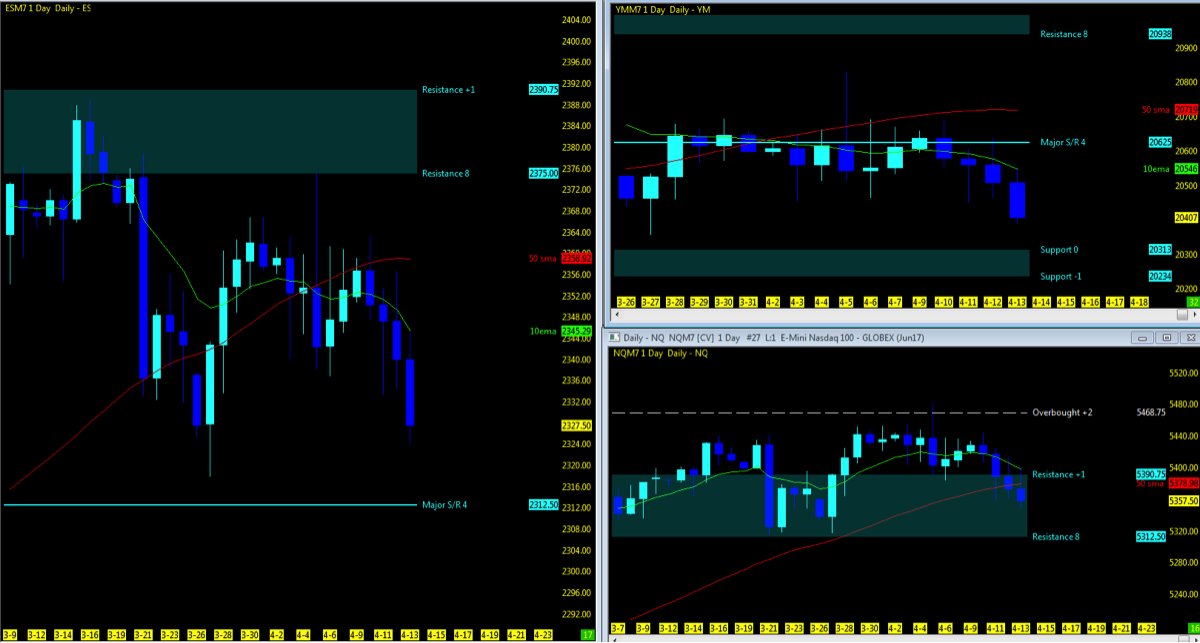
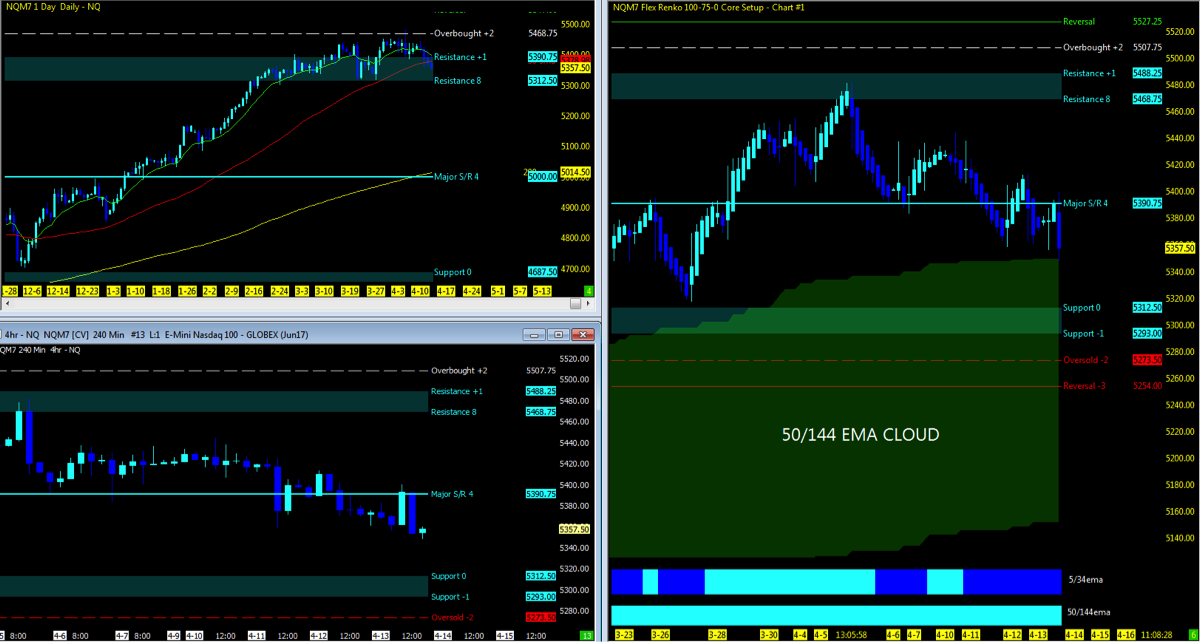
While the ongoing uptrend holds above each indices 50/144 ema on the range charts, market momentum draws near to the lower Daily MML levels and open gaps.

VIX levels finally catch some wind upside and managed to hit the low 16’s to close out the week in the high 15’s. Open gaps remain below as the market will return to close out these levels at whichever pace it decides it wants to. The inklings of a catalyst for pullback that I have mentioned in prior weeks have clearly made its way into the market. Overall unrest overseas and a loss of euphoric momentum of USA economic overhaul, seem to have put a stall and minor correction in the market which is not a bad thing either from a technical perspective, but concern of instability hangs over us.

The technical charts no longer in consolidation, have managed to pullback from the MML highs and while they remain in an overall trend to the upside, we definitely have a pullback in action. Looking downside as we hold under the 10 and 50 period moving averages, any continued price action down will look to the next level of MML support, open gaps below and the 200 period moving average. The 60m charts holding the lows of last week could be the sufficient level of price action downside that the market needed and we may also see a bounce back upside to the weekly VWAP and 50% pullback.

Key events in the market this week include Tax day, Multiple Fed Speakers, and Beige Book. Core Economic earnings for Q1 starts to role out this week, surely an indicator if the numbers are that great, which can also be smoke and mirrors at times. Don’t forget Washington politics and worldly imbalance to set the market in motion.

THE BOTTOM LINE

Watch for price action in between the 50 and 200ma to move in either direction. To the downside while the 200ma would be the next major level of support, downside MML levels and open gaps may be opportunities for the market to bounce upside. Upside needs to regain traction above the 10/50 ema which would initially be resistance at this point.

Technical momentum probability REMAINS in an UPTREND PULLBACK on the bigger pic. Signs of market weakness evident now after week 15. Observe the intraday on the 60/15m charts for any alert of the change in trend or continued movement upside. Keep a weekly VWAP on the 60m chart to monitor trend change as in week 15 price action managed to hold under for the most of the week. I will continue notify through social media and my daily outlook; posted 15 minutes prior to the US open of any updates throughout the week.

For the Indices ETF or long term holder, different rules may apply as quarterly re-balancing NOW PASSED and is my preference for managing such markets. Option to move trailing stops to key MML, Fibonacci or moving average levels can lock in more profit if and when a pullback may occur.

Attempting to determine which way a market will go on any given day is merely a guess in which some will get it right and some will get it wrong. Being prepared in either direction intraday for the strongest probable trend is by plotting your longer term charts and utilizing an indicator of choice on the lower time frame to identify the setup and remaining in the trade that much longer. Any chart posted here is merely a snapshot of current technical momentum and not indicative of where price may lead forward.


NQ – Nasdaq Futures

Technical Momentum: UPTREND Pullback

Using the Murray Math Level (MML) charts on higher time frames can be a useful market internal tool as price action moves amongst fractal levels from hourly to daily charts. Confluence of levels may be levels of support/resistance or opportunities for a breakout move.

CHARTS: Daily; Range; 4hr

Nearest Open Daily Gap: 5232.5

Lowest Open Gap: 4017


ES – S&P Futures

Technical Momentum: UPTREND Pullback

Nearest Open Daily Gap: 2315.75

Lowest Open Gap: 1860.75


Thanks for reading and remember to always use a stop at/around key technical trend levels.

Twitter:  @TradingFibz

The author trades futures intraday and may have a position in the mentioned securities at the time of publication. Any opinions expressed herein are solely those of the author, and do not in any way represent the views or opinions of any other person or entity.


The post Nasdaq Futures Weekly Trend Analysis & Outlook – April 17 appeared first on See It Market.
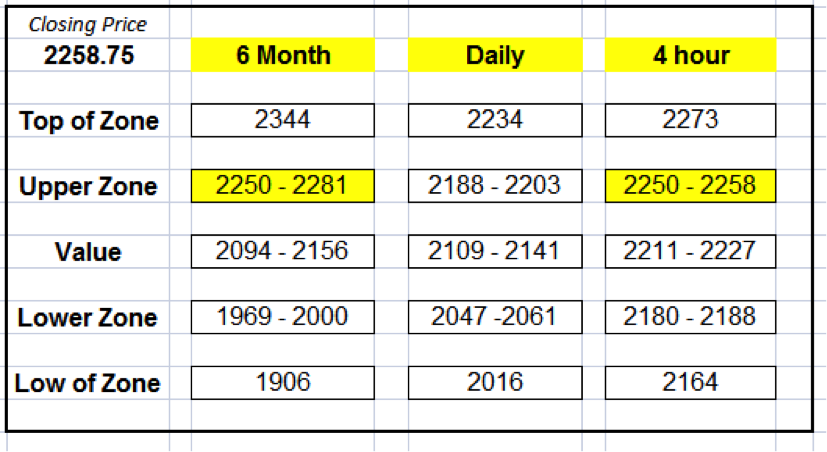
Nasdaq and S&P 500 Futures Weekly Trend Analysis – April 24

$
0
0

THE BIG PICTURE

So What’s Ahead?

The Major Stock Market indices continue to hold above their respective 50/144 day ema’s on the range charts. The Nasdaq Futures (NQ) are leading the way back upside to all time high as it regains its hold above the 50 day ema,

VIX levels in week 16 closing out in the mid 14’s have yet to breach the upper levels above 20 or to fall below 10 indicating an outlier in momentum which would surely initiate a larger move in trend and price action in either direction. Open gaps remain below as the market will return to close out these levels at some point. What will that catalyst be to take us lower? Daily market profile appears to be balanced signifying to this trader that markets continue to find value each day and unsure of any larger move is yet to be seen.

The technical charts with its move back upside on the NQ and lagging ES and struggling YM, have yet to be seen which index in the coming week will pull the others in sync. Is it enough for the NQ rally back up to pull along the ES and YM to regain its traction above the 50ma? Will it be the YM to drag down the rest with it? While the intraday 5-15 minute MML levels can offer opportunities in both directions, the 60m charts after pulling back off the MML highs to 50% pullback at the major support and resistance, price action around the 10 and 50ma will be a sign of which MML direction we are most likely to be headed to; upside resistance or downside support. In plain English; it’s decision time.

Key events in the market this week include Tax reform announcement on Wednesday, Earnings season (Thursday big day), end of month trading and GDP on Friday. Keep in mind the French political arena being closely monitored and the North Korean instability.

Note that you can also view my market outlook on YouTube.  Markets Covered: ES, YM, NQ, GC, CL


THE BOTTOM LINE

Watch the price action on the ES and YM to follow through to regain traction above the 10 and 50ma. News/information on tax reform this week maybe what the market needs to move in either direction in addition to key economic data this week. Any failure here, look to open gaps, lower MML levels and the 200ma for next levels of support.

Technical momentum probability REMAINS in an UPTREND on the bigger picture. Signs of market strength evident now after week 16 on the NQ. Observe the intraday on the 60/15m charts for any alert of the change in trend or continued movement upside. Keep a weekly VWAP on the 60m chart to monitor trend change. I will continue notify through social media and my daily outlook; posted 15 minutes prior to the US open of any updates throughout the week.

For the Indices ETF or long term holder, different rules may apply as quarterly re-balancing NOW PASSED and is my preference for managing such markets. Option to move trailing stops to key MML, Fibonacci or moving average levels can lock in more profit if and when a pullback may occur.

Attempting to determine which way a market will go on any given day is merely a guess in which some will get it right and some will get it wrong. Being prepared in either direction intraday for the strongest probable trend is by plotting your longer term charts and utilizing an indicator of choice on the lower time frame to identify the setup and remaining in the trade that much longer. Any chart posted here is merely a snapshot of current technical momentum and not indicative of where price may lead forward.


Nasdaq Futures  (NQ)

Technical Momentum: UPTREND

Using the Murray Math Level (MML) charts on higher time frames can be a useful market internal tool as price action moves amongst fractal levels from hourly to daily charts. Confluence of levels may be levels of support/resistance or opportunities for a breakout move.

CHARTS: Daily; Range

Nearest Open Daily Gap: 5232.5

Lowest Open Gap: 4017


S&P 500 Futures  (ES)

Technical Momentum: UPTREND

Nearest Open Daily Gap: 2315.75

Lowest Open Gap: 1860.75


Thanks for reading and remember to always use a stop at/around key technical trend levels.

Twitter:  @TradingFibz

The author trades futures intraday and may have a position in the mentioned securities at the time of publication. Any opinions expressed herein are solely those of the author, and do not in any way represent the views or opinions of any other person or entity.


The post Nasdaq and S&P 500 Futures Weekly Trend Analysis – April 24 appeared first on See It Market.
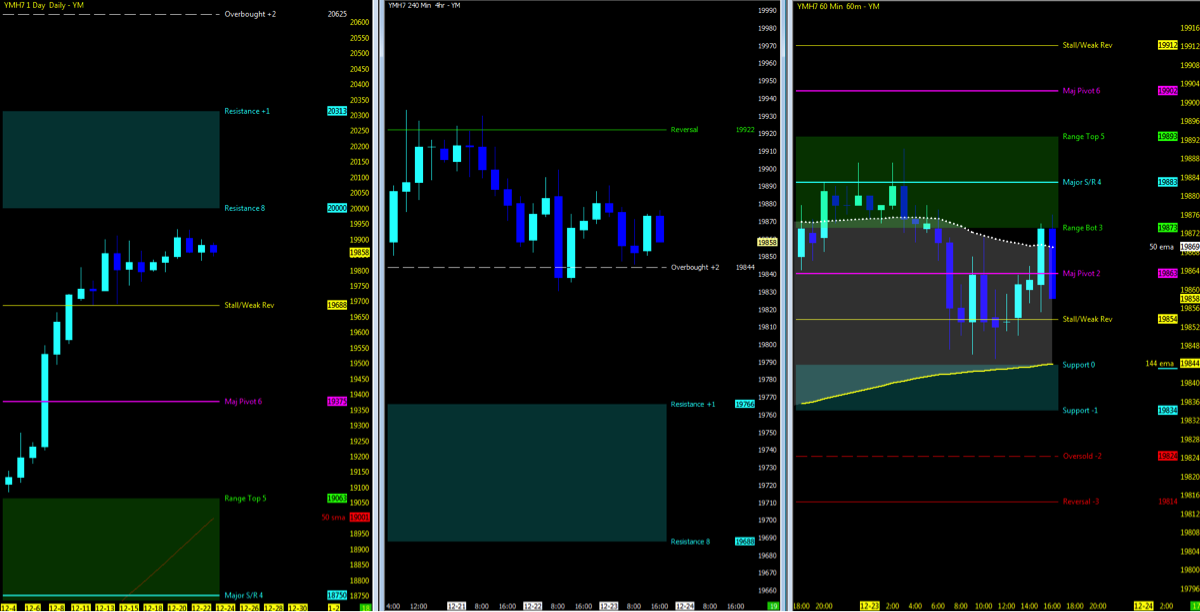
Nasdaq and S&P 500 Futures Weekly Trend Analysis – May 1

$
0
0

THE BIG PICTURE – What Lies Ahead?

The major stock market indices closed above their weekly open prices last week (recap which may be found here) with Nasdaq (INDEXNASDAQ:.IXIC) soaring to new all time highs in week 17, and the S&P 500 (INDEXSP:.INX) not far behind. This is yet another sign of the relentless uptrend that traders have been apart of for quite a while now.

It’s notable that each of the stock market futures indices (and cash indices) are holding above their 50/144 ema on the range charts.

Here’s a look at the action on the S&P 500 Futures (ES) and Nasdaq Futures (NQ):

Volatility Index (INDEXCBOE:VIX) levels closed out even lower than last weeks levels. The VIX now holds in the high 10’s.

With price action now back above the 10/50 day ma’s, traders have turned their attention on the S&P 500 and Dow Jones futures to the all time highs seen back in March. But any pullback may aim at the open gaps below. With no previous reference points on the NQ, daily volume profile and Murray Math levels or Fib extension/projections may be used to determine upside resistance in momentum. Any pullback will surely test the support levels and even close out an open gap or two. Keep in mind that institutional support remains well below at the 200 day ma which will take numerous levels to breakthrough to push downside.

Is the market overbought? Sure, but are you not tired of the continued stream of market apocalypse? I agree with many that at some point it will draw down and self correct but attempting to pick out the top is simply a lottery of wannabees that will say they told you so when it finally occurs. So, they just continue to publish it week, after week. The technical charts which are the foundation for this intraday trader for both directions and while a daily pullback here and there may be found, the overall big picture remains upside until otherwise.

Key events in the market this week include FOMC announcement, APPL/FB earnings, Yellen, Payroll, Upcoming French Elections and North Korean instability. Throw in Washington politics and economic reform and we have a week of sure uncertainty that lies ahead.


Note that you can also view my market outlook on YouTube.  Markets Covered: ES, YM, NQ, GC, CL


THE BOTTOM LINE

Key Events will most definitely play a roll in price momentum this week. To the upside, the YM and ES to regain and ring the all time high bell last seen in March. The NQ with MML levels just above on the higher timeframe surely could be a carrot dangling ahead. Momentum to the south can also turn on a  dime in key events which may easily test the 10 and 50 period moving averages as well to close out the two open gaps from week 17.

Attempting to determine which way a market will go on any given day is merely a guess in which some will get it right and some will get it wrong. Being prepared in either direction intraday for the strongest probable trend is by plotting your longer term charts and utilizing an indicator of choice on the lower time frame to identify the setup and remaining in the trade that much longer. Any chart posted here is merely a snapshot of current technical momentum and not indicative of where price may lead forward.


NQ – Nasdaq Futures

Technical Momentum: UPTREND 

Using the Murray Math Level (MML) charts on higher time frames can be a useful market internal tool as price action moves amongst fractal levels from hourly to daily charts. Confluence of levels may be levels of support/resistance or opportunities for a breakout move.

CHARTS: Daily; Range

Nearest Open Daily Gap: 5512.75, 5449.75

Lowest Open Gap: 4017


ES – S&P Futures

Technical Momentum: UPTREND

Nearest Open Daily Gap: 2374, 2353

Lowest Open Gap: 1860.75


Thanks for reading and remember to always use a stop at/around key technical trend levels.

Twitter:  @TradingFibz

The author trades futures intraday and may have a position in the mentioned securities at the time of publication. Any opinions expressed herein are solely those of the author, and do not in any way represent the views or opinions of any other person or entity.


The post Nasdaq and S&P 500 Futures Weekly Trend Analysis – May 1 appeared first on See It Market.
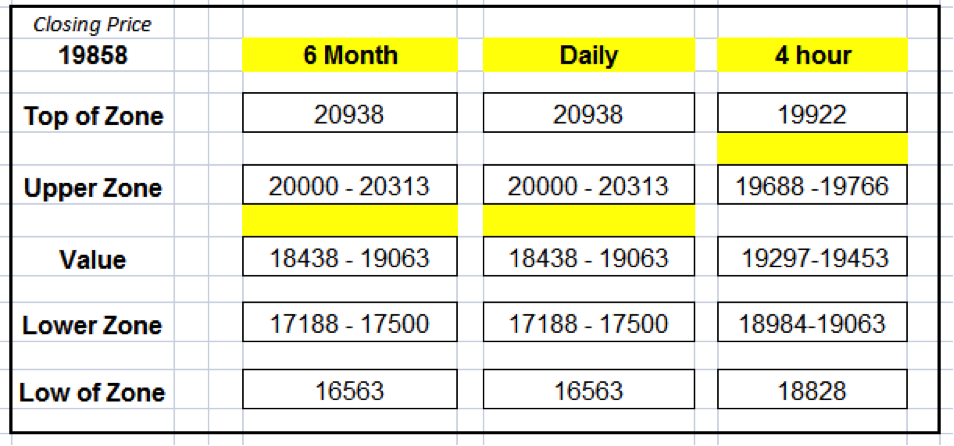
Viewing all 89 articles
Browse latest View live


Latest Images