While I consider myself to be primarily a futures index trader, how could I not pass up the thought that as the indices chop it up at their highs, Crude Oil has been sinking to a low not seen since 2007-09. As I am truly enjoying filling up my gas tank with prices below $2 per gallon, I have to wonder how long this may last and at what point a turnaround come. What will it look like? How do I get in with a lower risk entry? The twitter feed is surely burning up the airways as traders get antsy at these lows and highs on the inverse trading ETFs.
As crude futures near a point of downward resistance, it may occur to us crumb traders that eventually price will rocket or chop its way back up. The key is finding signals that indicate a tradable bottom that align with your risk and timing.
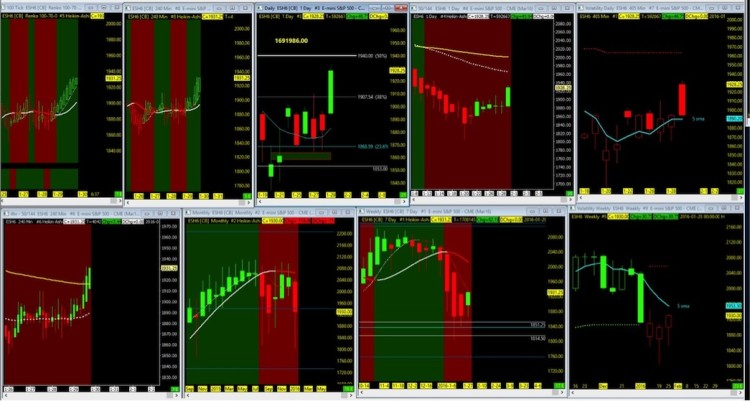
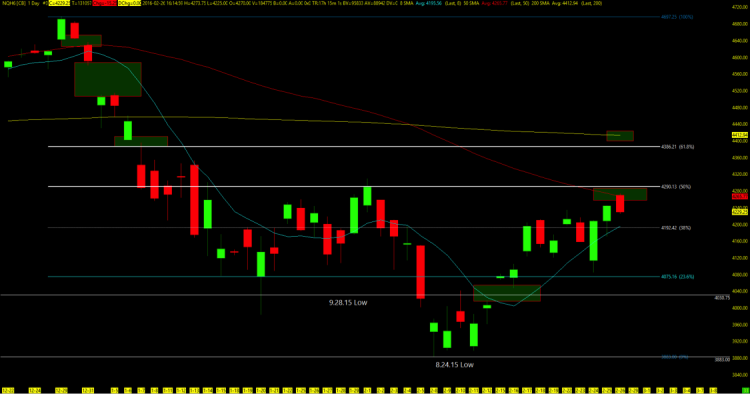
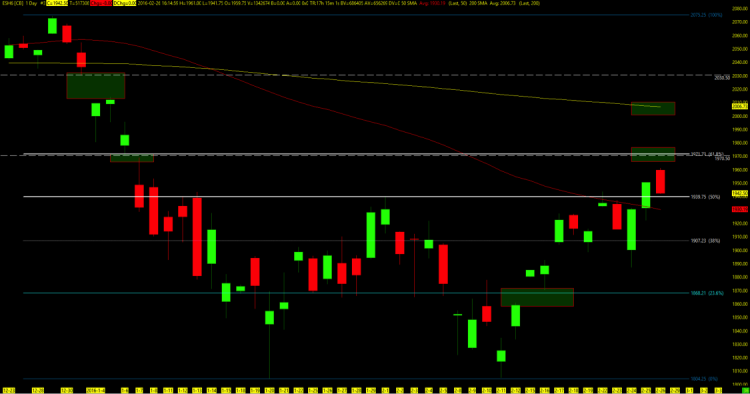
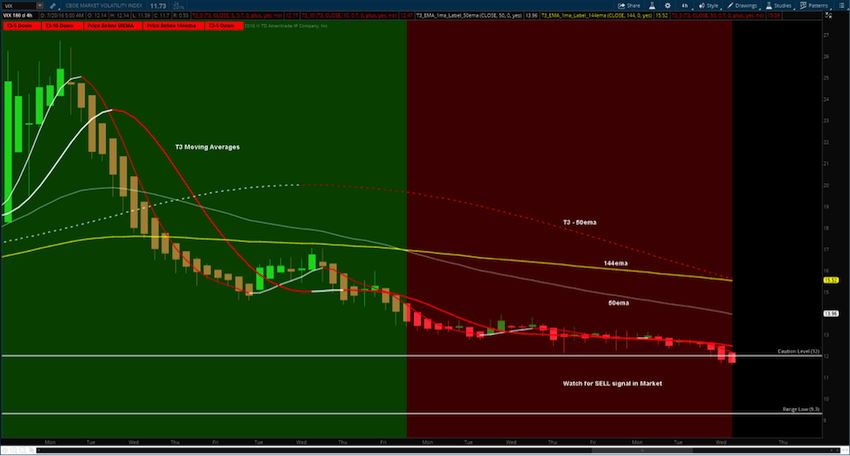
Since the four equity major indices turned upside in mid-October to new all-time highs, all we have managed to do is chop at the top. I couldn’t tell you what the exact bottom was in October because I was managing my trade downside and working to identify the change in trend to reverse positions. We may have a similar situation approaching on the oil ETF’s and ETN’s. I couldn’t tell you when that may happen as price could rocket higher, have all the crumb traders on board and then tank once again. Or just continue lower without much of a rally. That’s the risk we take as traders when fishing for a bottom. And that’s why we always use stops and have a plan.
To keep it simple, I want to share some potential setups regarding Crude Oil. Traders may not catch the absolute trading bottom, but I believe that the probability of success will be increased if one looks to enter a trade based on the setups, indicators, and steps highlighted below.
Looking for Positions to go:
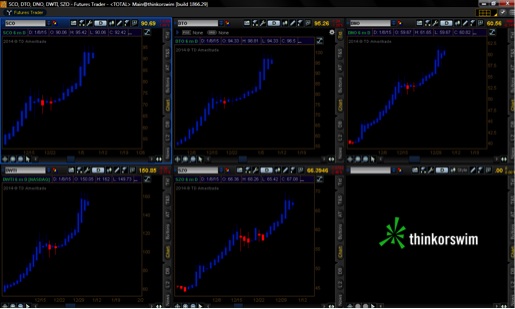
Long: USL, USO, DBO, OIL, OIH, OLO, UCO, UWTI
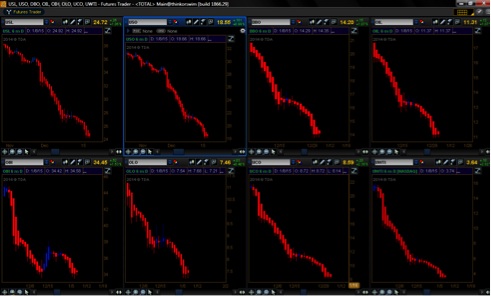
Short: SCO, DTO, DNO, SZO, DWTI
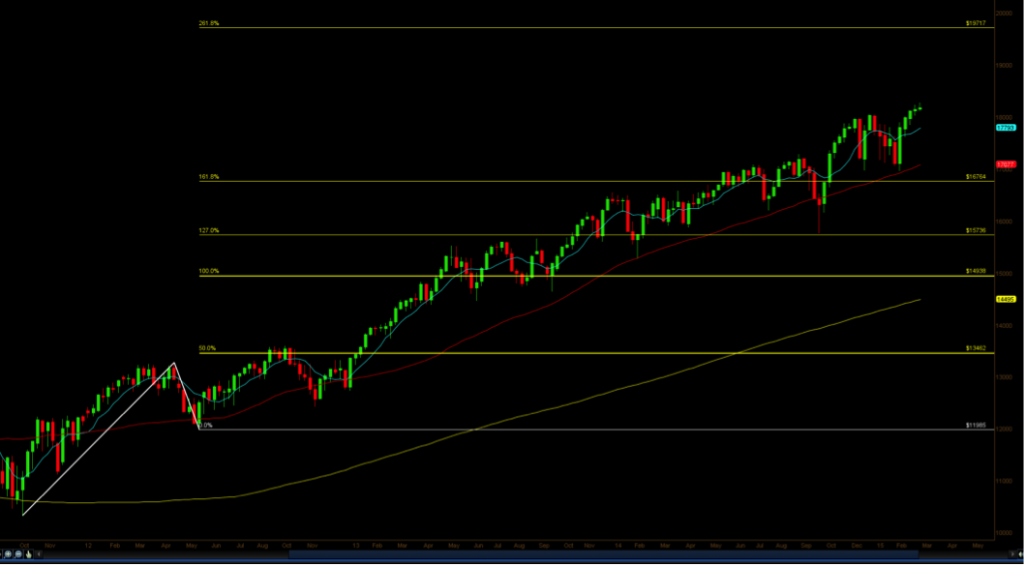
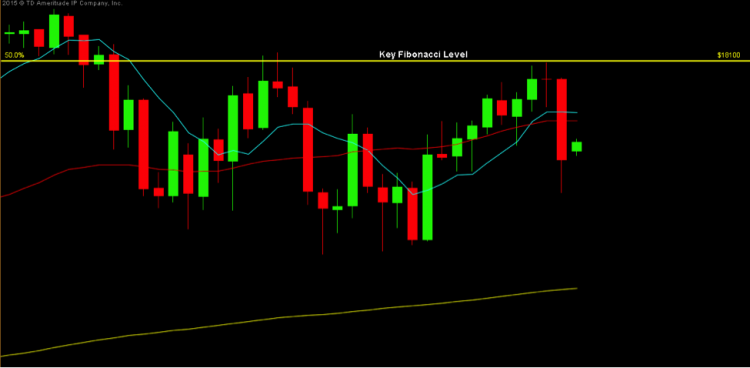
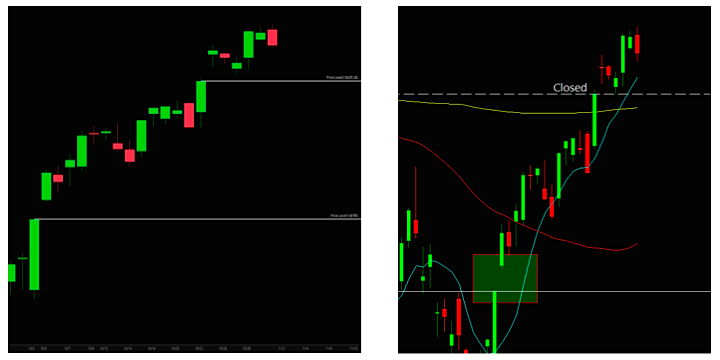
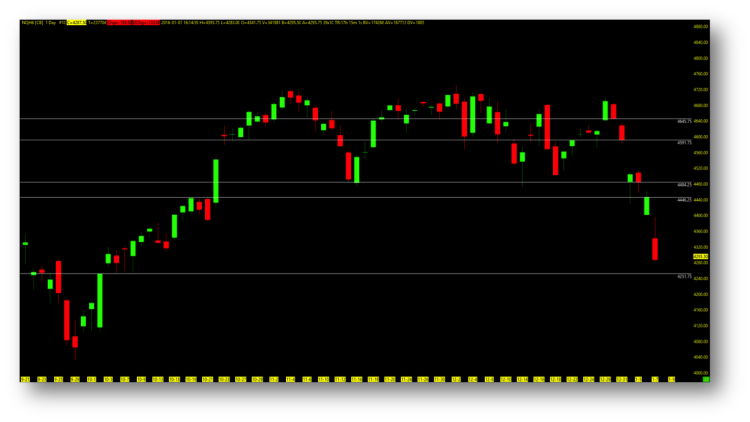
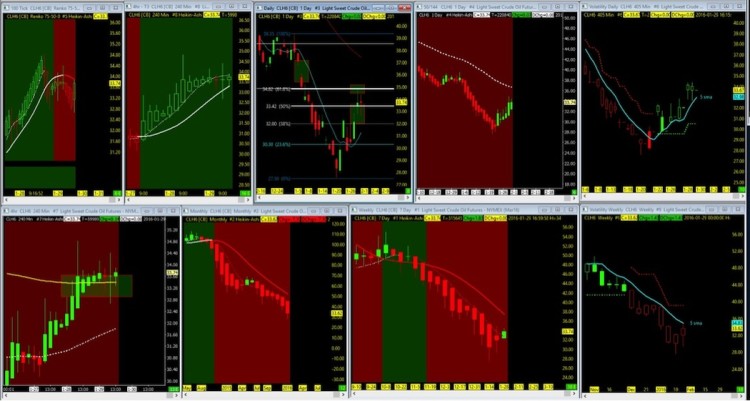
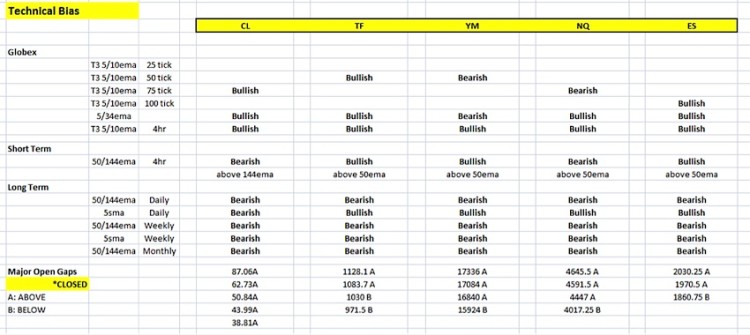
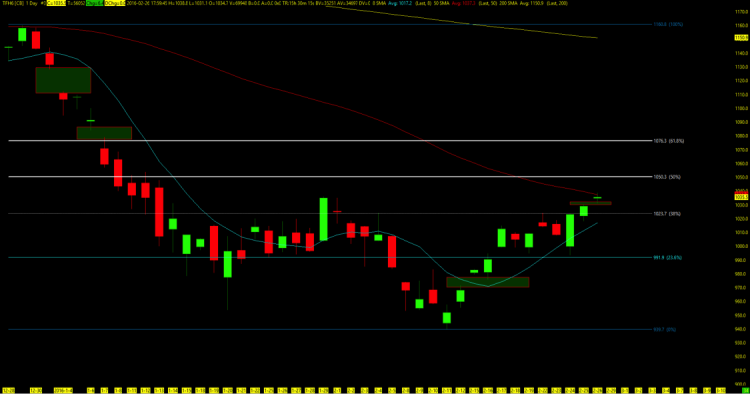
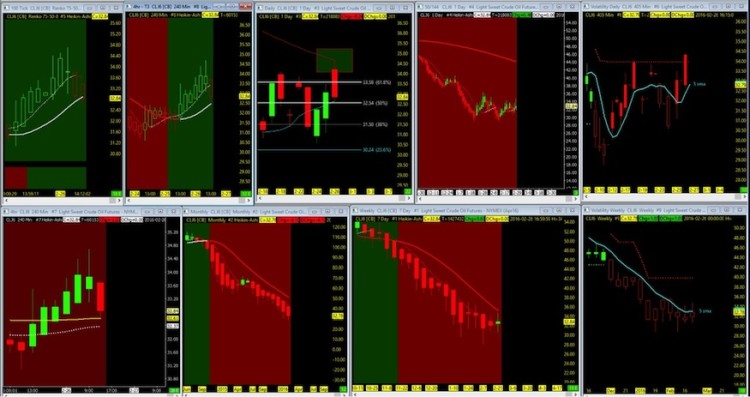
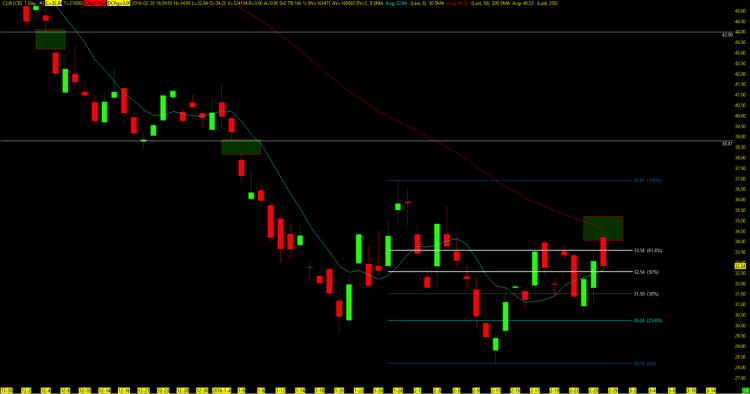
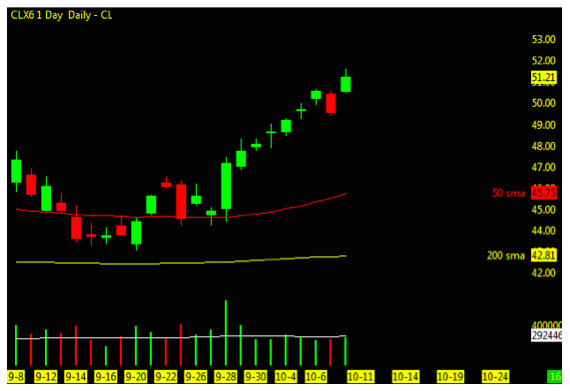
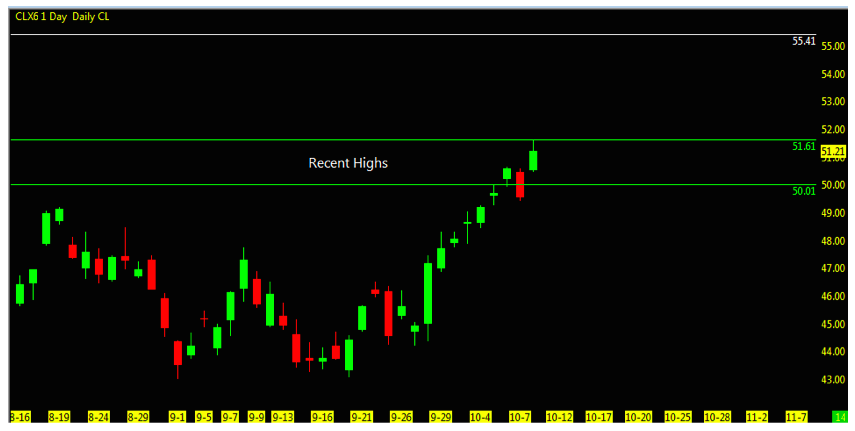
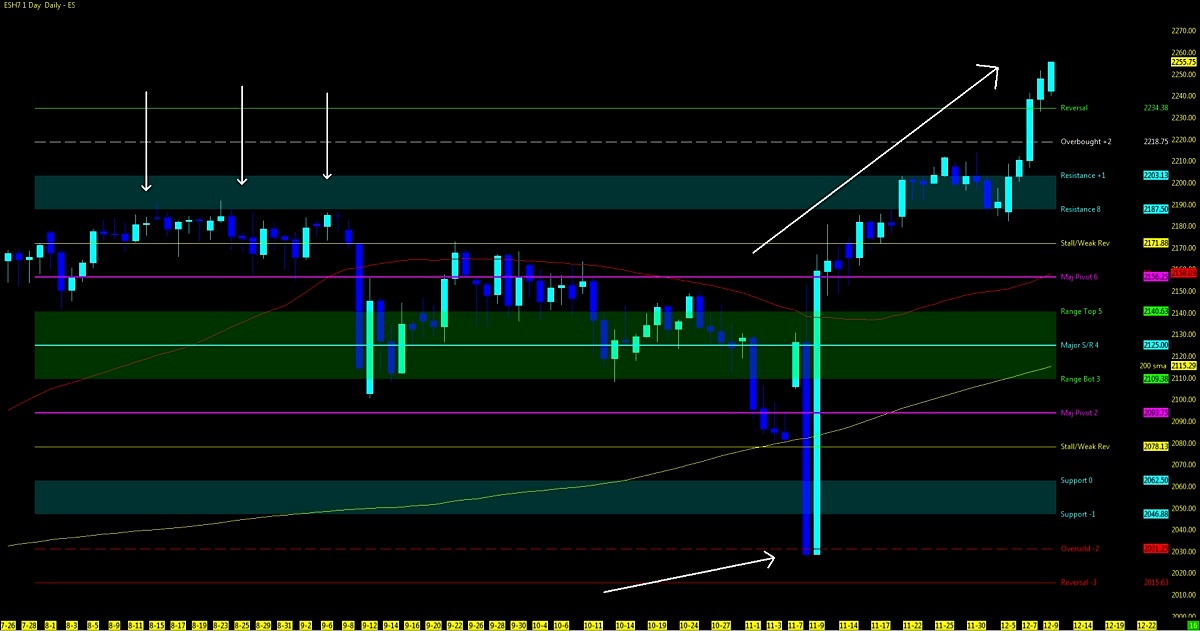
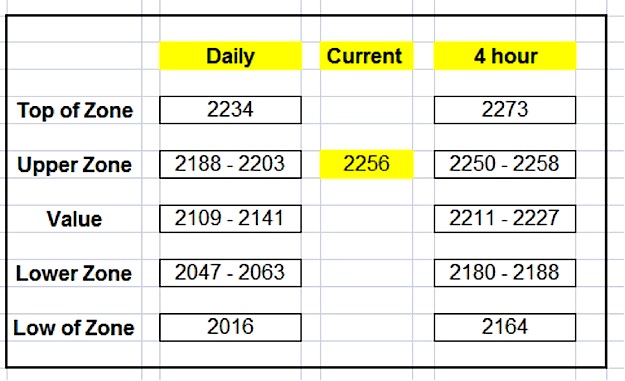
Step 1: Watch crude on the daily chart. Key levels that I am watching: 49.9, 46.83 and 33.20 downside.
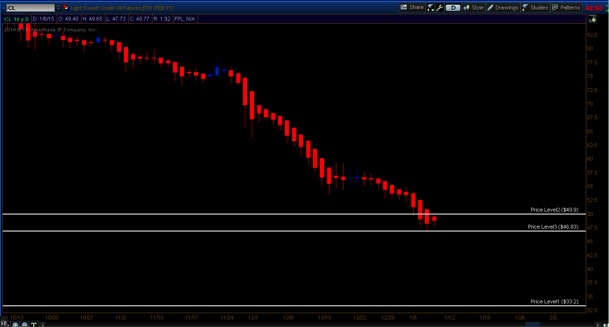
Current price action on crude: 48-49.
Confirmed downtrend since 8/4/14.
11/21/14 was the last indicator of possible turnaround with no follow through.
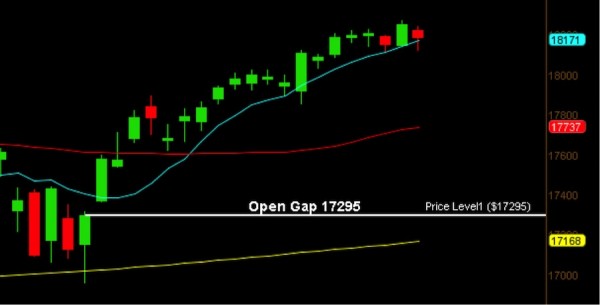
If price action were to find a low at the end of today’s session, a price break and close above 59.9 would be signs of a confirmed uptrend. Full confirmation of an uptrend based on my trading strategy may not be until around 70 which may cause one to wish they had gotten in lower. If price action were to continue to drop, these levels would be lower. So are we at that point that price has found its bottom? Should I just go in blindly and place a trade in the reverse? Surely you could and roll the dice to see how your trade shakes out.
I’m not one to look at the markets and say that they are oversold or overbought. Often times, traders will get caught up in that mindset and then price continues to move in that same direction and they get cut out of the trade early (or take larger losses) because of some fallacy the market wants you to believe in. What would then increase my probability that I have a trend and not get caught from a blind entry at this current time?
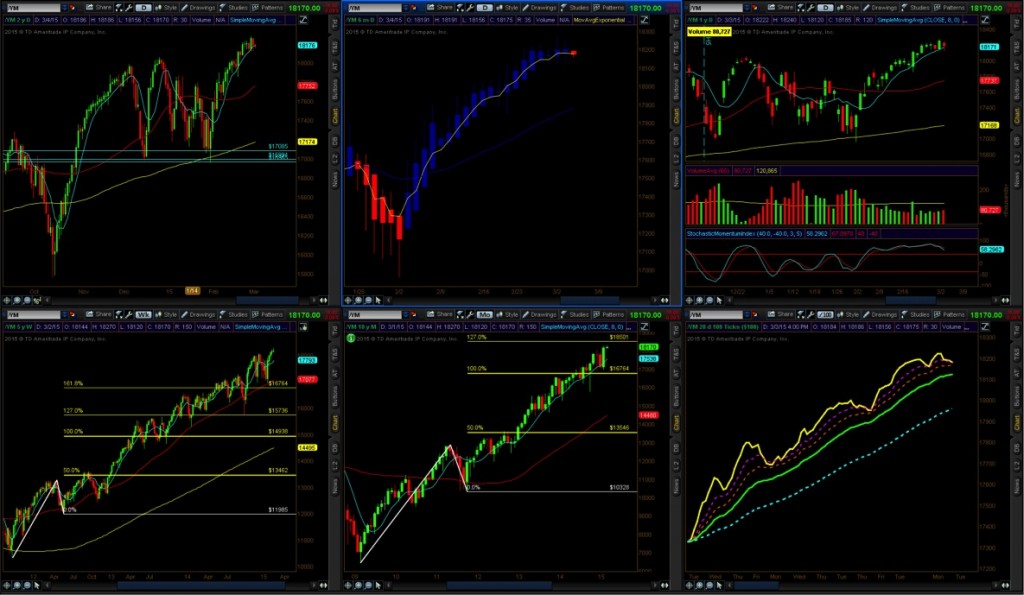
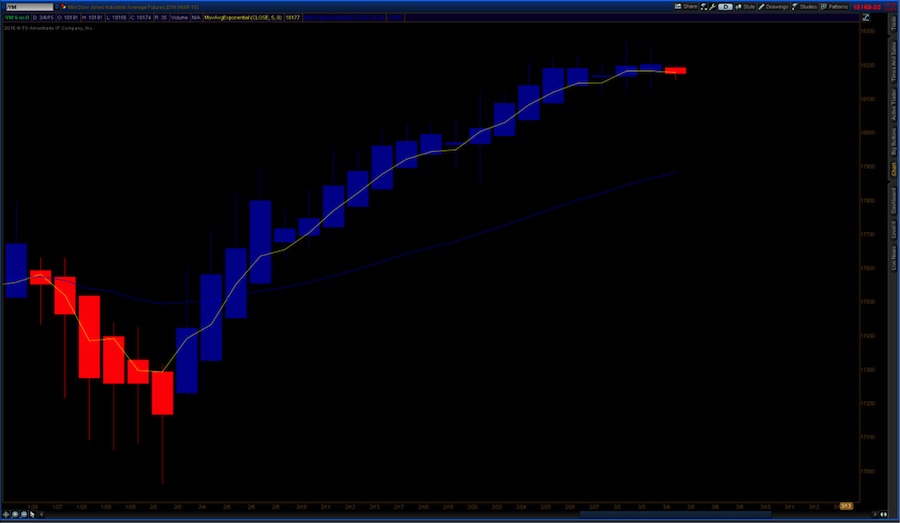
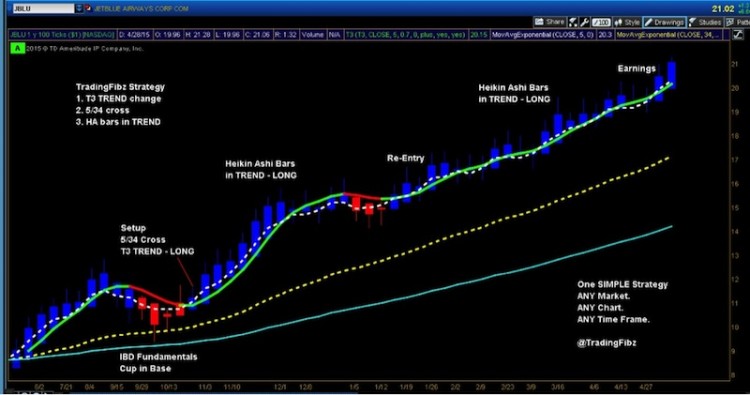
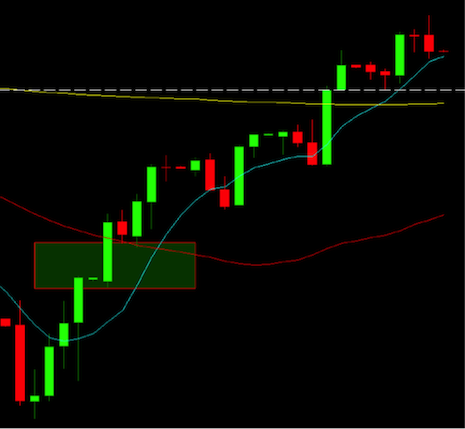
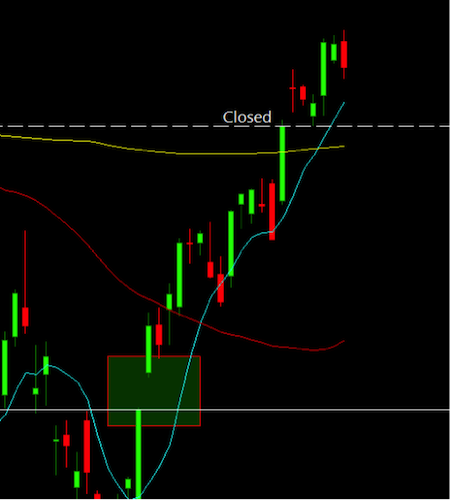
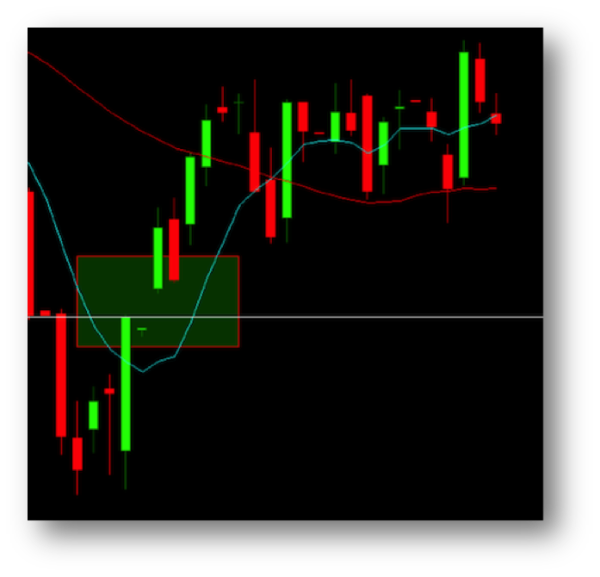
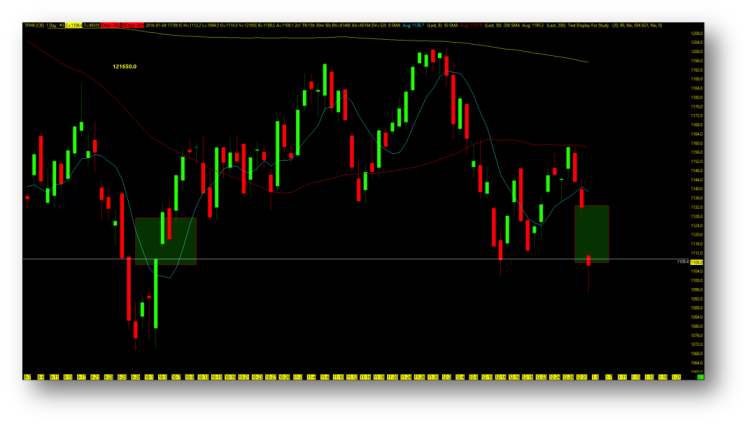
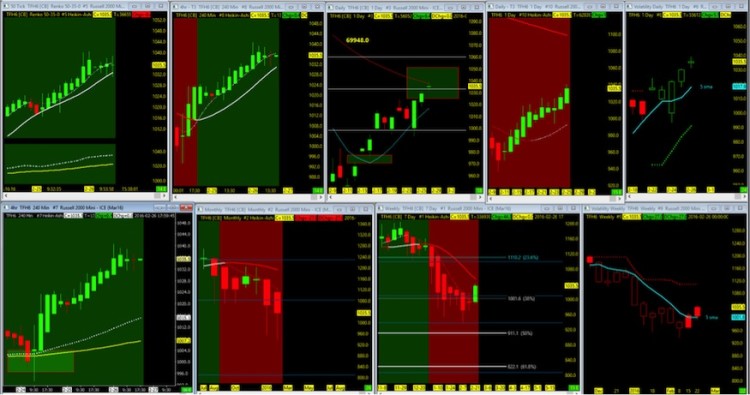
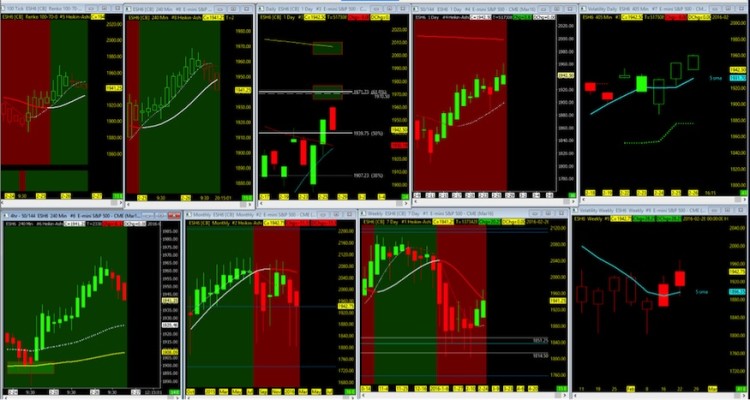
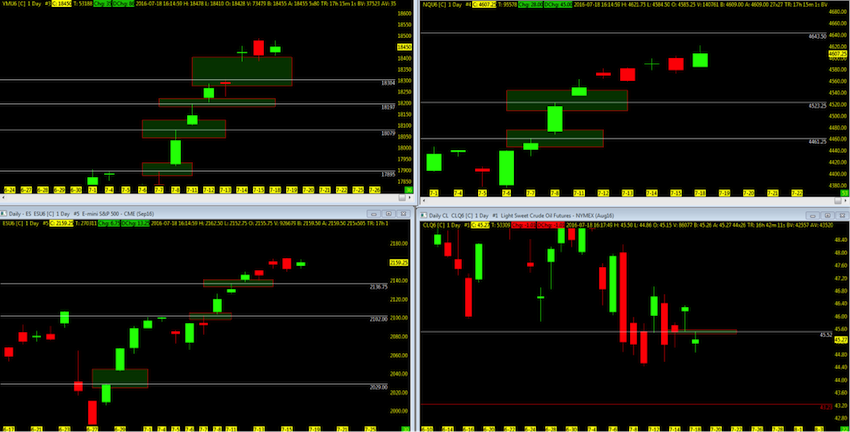
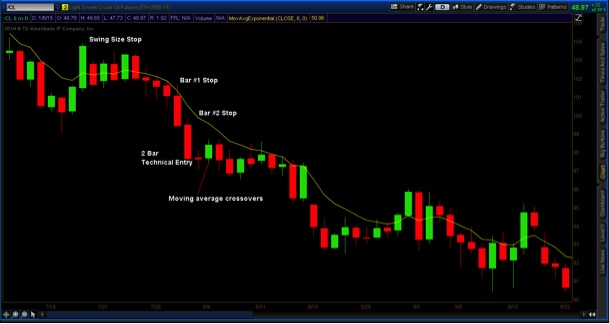
1. Look for two daily bars to cross over the 8 period moving average – This would be the absolute riskiest entry but a confirmation of the start of a possible turnaround. Place a stop below bar #1 or #2 based on risk level. As seen below when CL initiated its downslide.
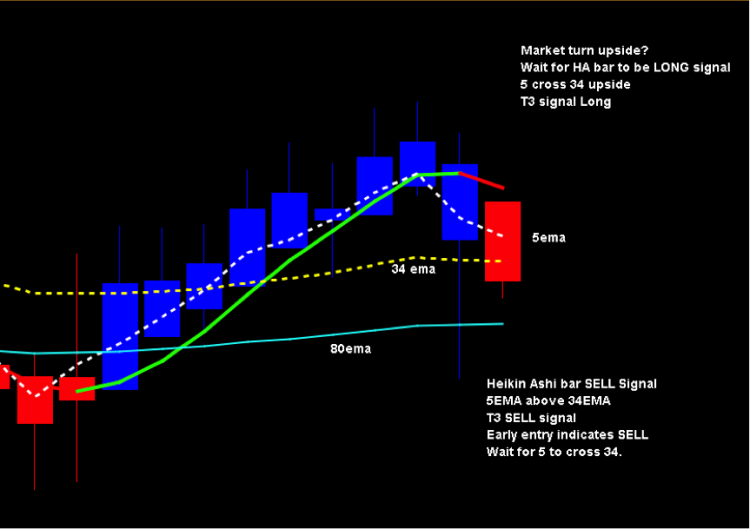
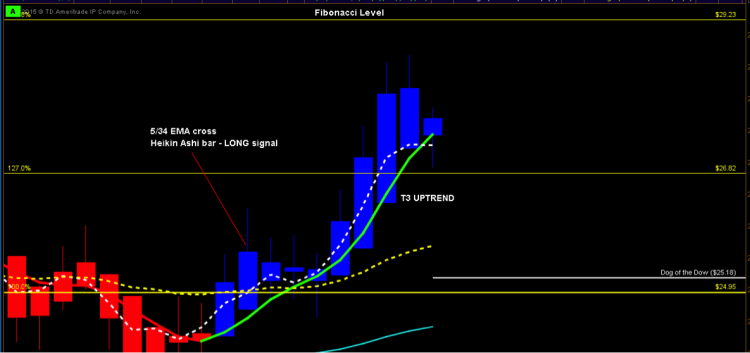
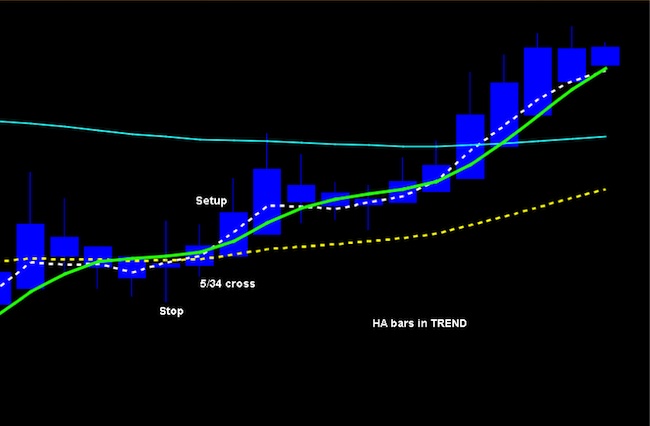
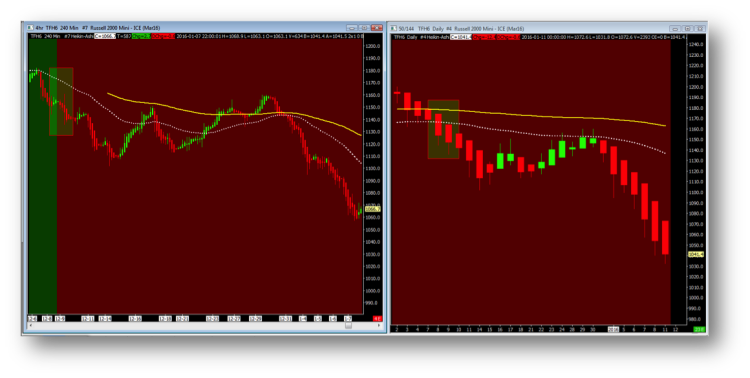
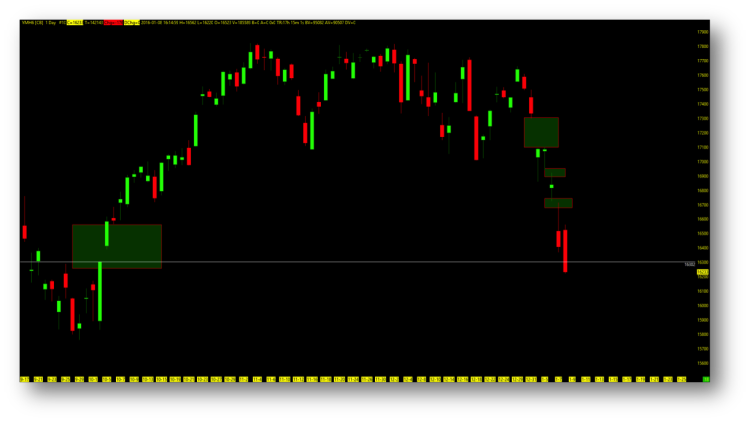
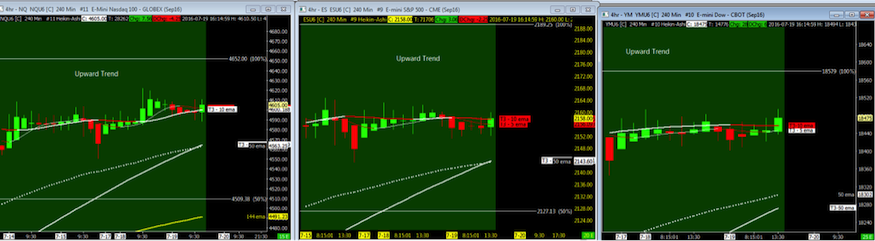
2. Heikin Ashi bar in trend with solid body and shadow/tail – Reinforcing the direction of trend and eventually a way to manage the trade for the long term.
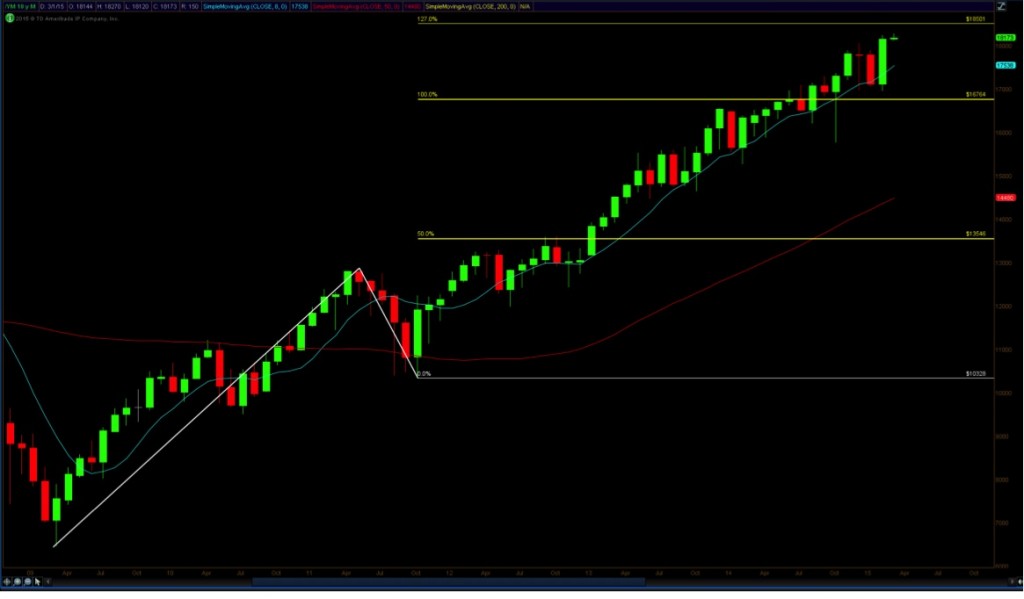
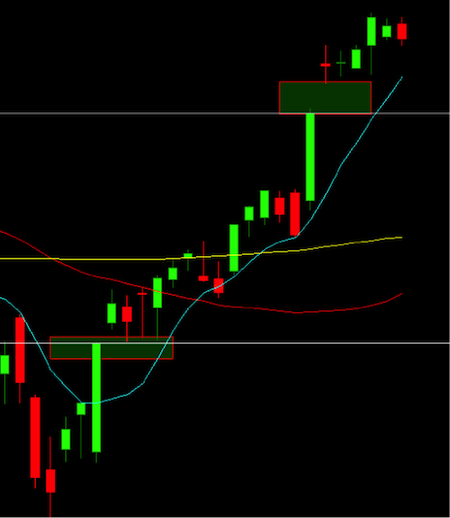
3. 5/34 moving average crossover – Trend indicator of the 5 period moving average crossing the 34. Most ideal if Steps 1 and 2 above where to all happen at the same moment of the MA crossover.
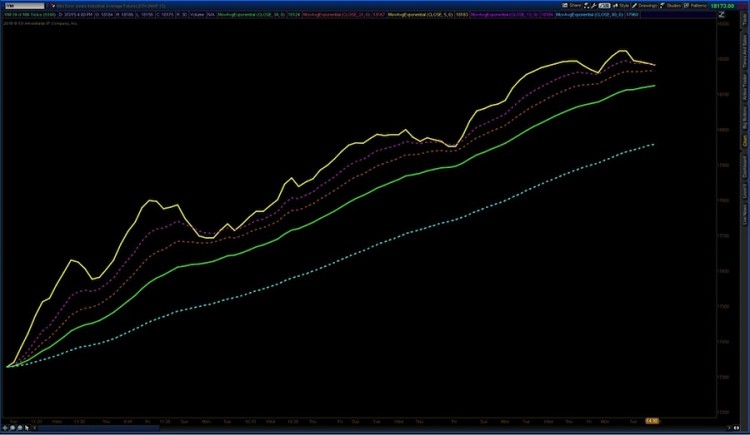
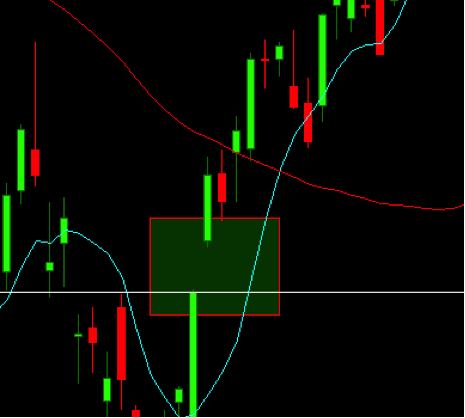
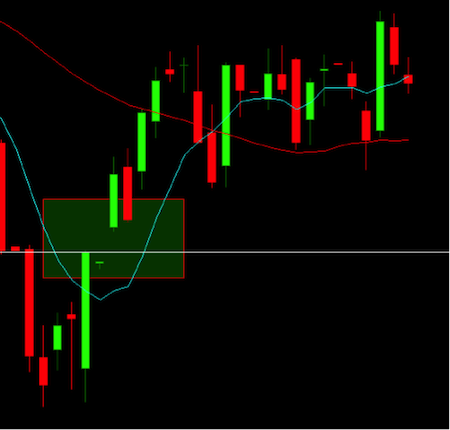
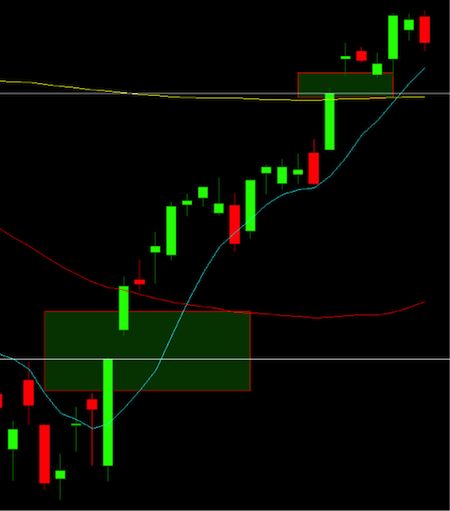
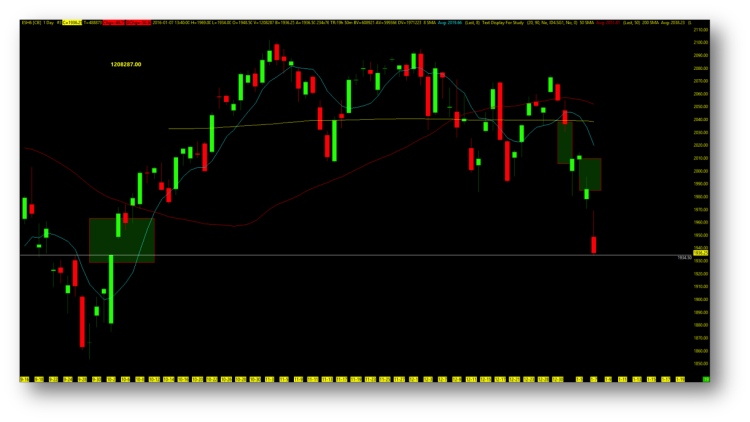
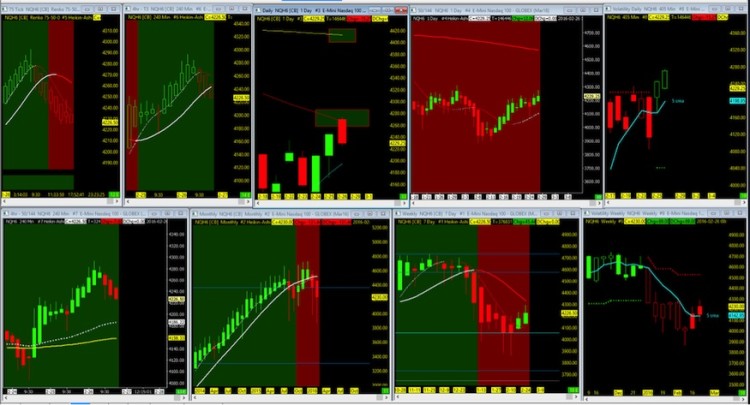
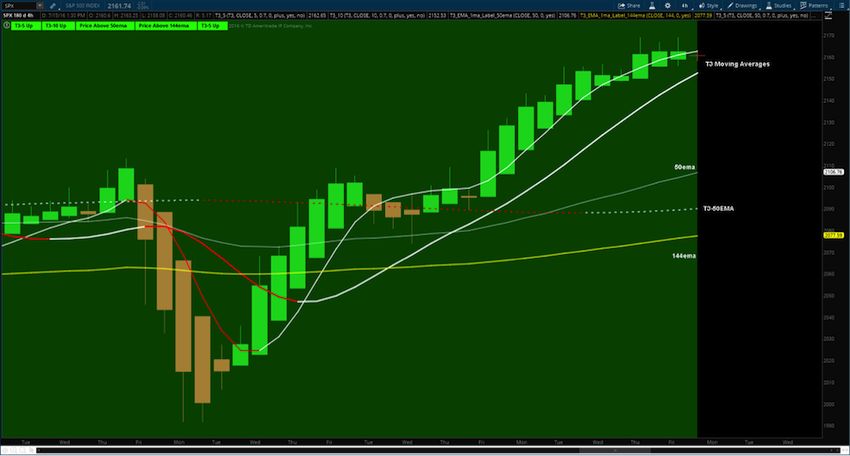
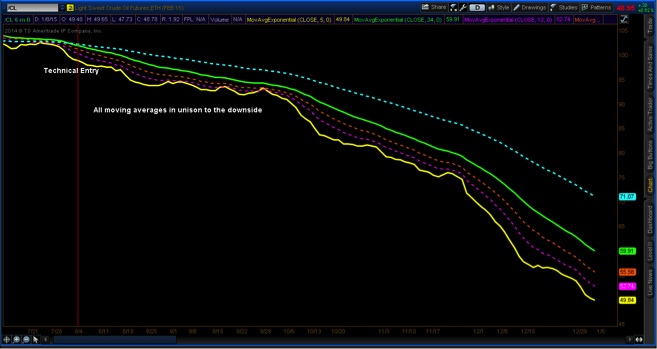
4. 5 above 13 above 21 above the 80 period moving average – The strongest of trend indicators that if in unison will confirm the direction. As seen here on entry downside in August of 2014, always remained in trend in combination with HA bars.
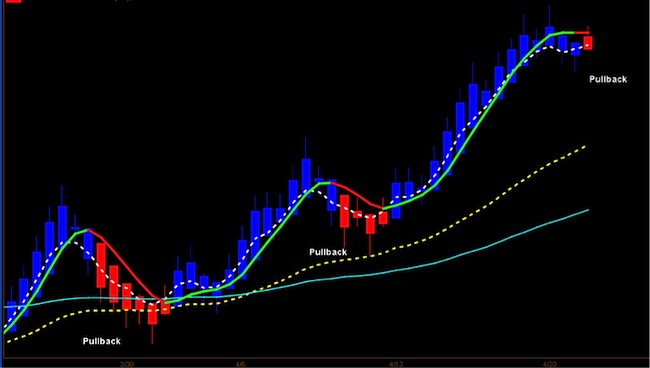
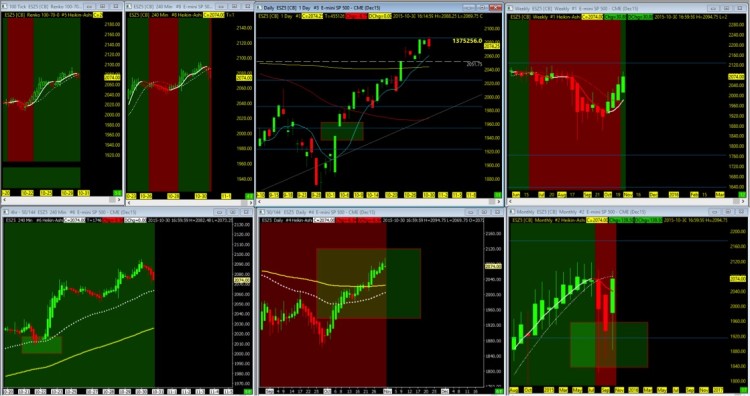
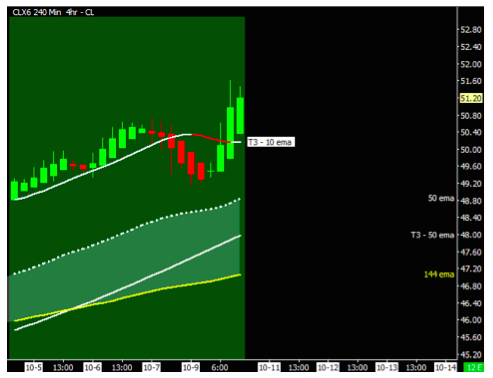
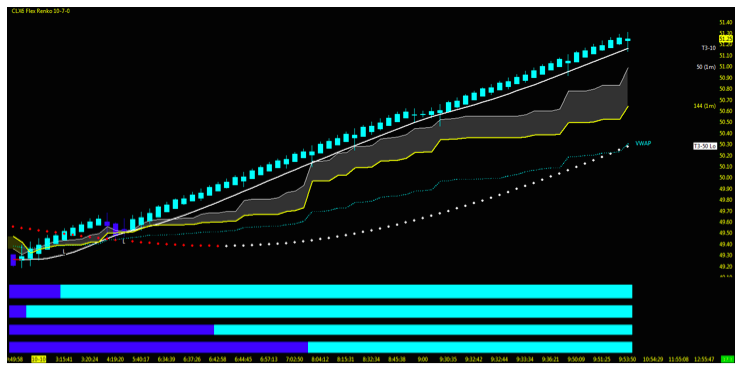
Consider also watching for price and momentum to be in unison. If you miss the initial entry, a pullback on an intraday basis can offer another opportunity. When all trends line up on a daily and intraday basis, the probability of it continuing in trend is more likely.
Once I have confirmed what I believe to be a technical setup to the long side on the futures CL, follow through on any of the positions, whether long or short on the ETF’s and ETN’s, may all be managed using the same strategy. Best and ideal setup will be consolidation at the lows and an intraday setup that follows the same strategy posted above for entry.
Timing is key. Traders want to decrease risk, while increasing probability. Thanks for reading and trade safe!
Follow David on Twitter: @TradingFibz
The author has no positions in any of the mentioned securities at the time of publication. Any opinions expressed herein are solely those of the author, and do not in any way represent the views or opinions of any other person or entity.
The post Trading Setups: It’s All About The Oil appeared first on See It Market.